
Commerce Insights
Overview
This technical guide details how to install the Commerce Insights package for YaaS and provides valuable insight into how it integrates with the SAP Hybris Enterprise Commerce (EC) platform to provide you with a new, powerful world of commerce analytics. The reports are:
- Real Time — The realtime dashboard keeps track of revenue, orders, and site visitors, second-by-second.
- Merchandising — Provides data on sales by products, including SKU-level reporting.
- Marketing — Provides an overview of marketing channels, including email campaigns tagged with UTM parameters.
- Orders — View historical and current orders for your store.
- Customers — A comprehensive list of new and repeat customers, with click-through data to view all purchase behavior across their lifetimes with your business.
- Insights — Analyzes store data and provides a business intelligence layer to help drive conversion.
Commerce Insights registers an interceptor with your EC installation. The interceptor sends your product, orders, carts, and customer events to YaaS. The next section goes over the installation process.
Setup Overview
There are three core steps to start with the Commerce Insights service: Configure your Builder site, set up the SAP Hybris Enterprise Commerce (EC) extension, and add the JavaScript event tracking tag.
Configure your Builder site - This step is mandatory, regardless of implementation or e-commerce platform.
The setup process includes:
Set up the EC Extension - All EC customers must do this step. Customers on different platforms can integrate with Commerce Insights by sending data to the API endpoints.
The setup process includes:
Javascript tracking - Tracking implementation is situational. If you are on YaaS, the JavaScript tag file is included in the plug-in under the name commerceinsights.tag. For all other API-integrated clients, tracking is required.
The setup process includes:
Configure Builder
The Builder is a YaaS administration interface for the development, registration, and management of modules and services that originate from subscriptions or your own development. Before proceeding with any further integration, set up your Builder site.
Site configuration
If you don't have an existing account or project with YaaS, follow the Builder documentation to set up your account and subscribe to the Commerce Insights package. After you subscribe, the Builder displays a new Commerce Insights tab.
- In the Builder, navigate to your project and click Commerce Insights.
- Click Settings and another set of tabs appears.
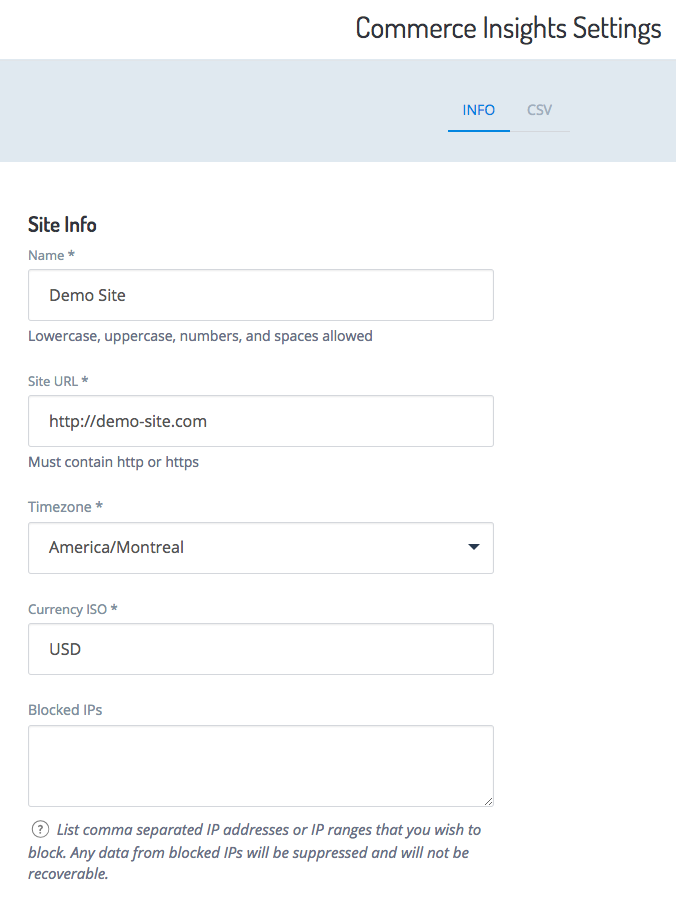
- Click the Info tab.
- Fill in the required data: site name, URL, site time zone, and site currency.
- Click SAVE to create your site.
Create a client
After setting up the Builder, you need a set of OAuth2 credentials for authenticating with the Event API. Go into your YaaS project and create a new client:
- Select your project from the Projects list.
- In the left-hand navigation, select Clients.
- Click + CLIENT.
Set up client scopes
Scopes can either grant or restrict access to parts of Commerce Insights. Set the scopes using these steps:
- In the Builder, navigate to your project.
- Click Development > Clients and then either click + Client to add a client, or select a user role to edit.
- Click NEXT without granting the selected client any scopes.
- Provide a descriptive identifier and Display name. Use a name that clearly indicates the parameters are for the Commerce Insights integration, such as
comminsights-mystoreandClient for Commerce Insights (my store). - Add a description, as it helps identify and sift though multiple clients later.
- Click SAVE to save the new client.
- Go back into the client and look for the Client Authorization section. The system generates a set of OAuth2 credentials.
- Click SHOW. The system shows the client ID and client secret you will use to send Commerce Insights data.
- For the EC Guide, use these codes in the YaaS Credentials section.
Two core scopes for a user are:
- hybris.comminsights-sso_view - permission to view reports
- hybris.comminsights-provision_manage - permission to create/update site settings
Set up Enterprise Commerce
The Commerce Insights package requires all SAP Hybris Enterprise Commerce (EC) customers to install the Commerce Insights EC extension. The extension acts as an interceptor with your EC installation by sending your product, orders, carts, and customer events to YaaS. The following section reviews the installation process.
Install the EC extension
To use Commerce Insights, activate and install the extension for HMC (EC Management Console) and ensure that you are using with the latest version. Familiarize yourself with the Builder documentation before beginning this section.
- Download the extension from the SAP Store and extract it to a permanent location.
- Add the path to Commerce Insights into your localextensions.xml file in the hybris config folder:
<extension dir=".../commerceinsights" />. - On the Command Line Interface (CLI), integrate the extension into EC. Within the directory ${hybris}/bin/platform, run:
source ./setantenv.shant cleanant all- Bring up localhost: http://localhost:9001.
- Check that commerceinsights is an activated extension, and initialize the EC master system or update it if you have existing EC data.
- Restart after the update completes.
- Access the HMC with a URL such as http://localhost:9001/hmc/hybris. A new Commerce Insights section appears. Review the System Status page and ensure that your cron jobs are enabled and site connections show success.
- Go to http://localhost:9001/commerceinsights/ and check that Commerce Insights works in your web browser.
- The installation automatically injects tracking code into the front end of your YaaS storefront by adding a commerceinsights.tag file to the analytics module.
- Optional: To use customized tags to track additional marketing attribution, edit the contents of the commerceinsights.tag file to incorporate the tags that your marketing team tracks. See the Optional tracking section for further details.
- Check the cron jobs in the HMC. See the EC Configuration section.
ant all, or any time you run an ant clean, the extension updates certain build dependencies. If ant exits with a message that says to run it again, do so. This should only happen the first time.EC configuration
The Commerce Insights extension uses a configuration properties file, local.properties, to set installation-specific information and local settings for your installation. The information in your local.properties file requires information specific to your site to set up your installation. The indented texts in the following examples show which settings require edits.
YaaS credentials
The client configuration uses YaaS client credentials to ensure secure sending of end user data. Each of the configurations specifies YaaS environment information. Each site and each environment requires a separate YaaS client. Changing this data in your local.properties file allows users to move from testing to sending data to the production servers.
The first step is to go into your YaaS project and create a new client. Do not grant this client any scopes. The identifier and name can be anything, but use something that clearly indicates it is for the Commerce Insights integration, such as comminsights-electronics and Client for Commerce Insights (electronics store).
After you create the client and save it, go back into the Client section of your project and look for the Client Authorization section. The system generates a set of OAuth2 credentials.
The following is an example of your EC install local.properties file in the config directory.
; Replace electronics with your CMS site name. At this time the **site.id** should always be `default`
commerceinsights.site.id.electronics=default
commerceinsights.outboundConnectionConfig.client_id.electronics= # place the YaaS client ID here
commerceinsights.outboundConnectionConfig.client_secret.electronics= # place the YaaS client secret here

; The default maps also use the following, set them to the public URL prefix for your site
; media.electronics.https=
; media.apparel-uk.https=
Activate cron jobs
After you install the plug-in and are ready to start sending data, there are four cron jobs to activate in the EC Merchant Cockpit: 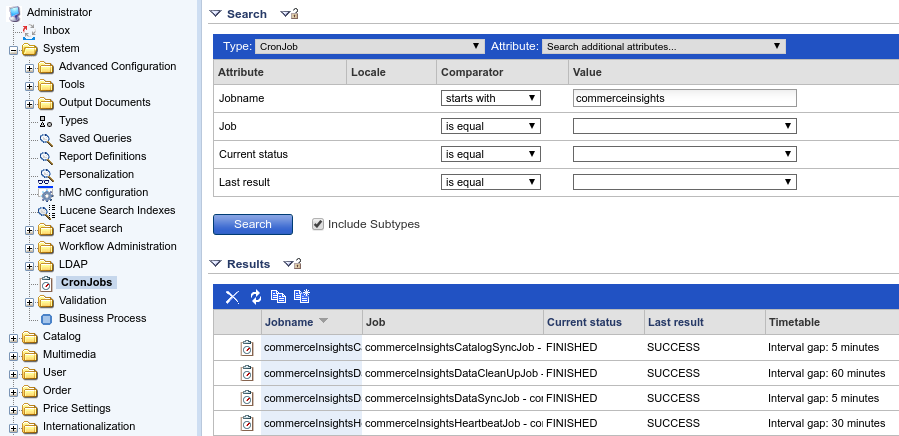
- commerceInsightsDataSyncCronJob - Data sync (every 5 minutes)
- commerceInsightsHeartbeatCronJob - Heartbeat (one per node, every 30 minutes)
- commerceInsightsDataCleanUpCronJob - Data clean up (every 60 minutes)
- commerceInsightsCatalogSyncCronJob - Catalog sync (every 5 minutes)
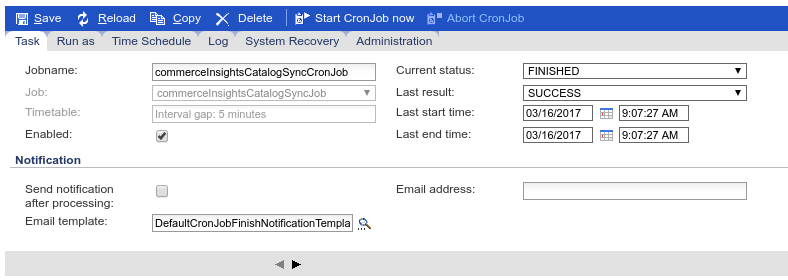
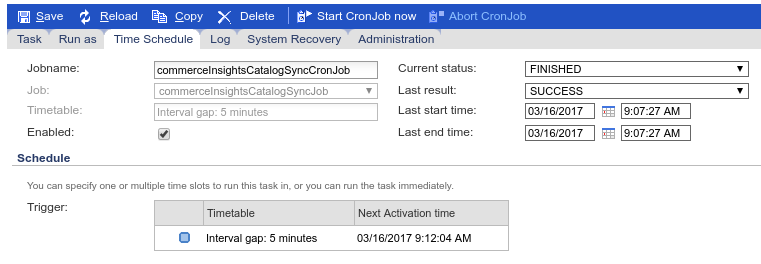
Assign status, start times, end times, and any other options for each job.
Data sync cron job
The data sync cron job setting is designed to give you the flexibility to throttle how quickly data sends to Commerce Insights. As a consequence, it impacts how fast Commerce Insights receives and displays data for your users. It is important to make sure it runs often, so your end users can have data that is timely and up-to-date. For this reason, set it to run every five minutes.
Heartbeat configuration
The Heartbeat is simply a health check. It keeps track of the last time the solution heard from you.
Database event statuses
A staging table holds events. Each record in this table has an associated status. A cron job periodically removes events from this table based on the status. A configuration setting, commerceinsights.cronjob.cleanUp.statuses, controls which events are removed. The valid status codes are as follows:
- ACCEPTED = The system received and consumed the event. In general, you always want valid objects.
- REJECTED = Event is malformed. By default, the system does not remove these events, giving you an opportunity to review and address any issues.
- NOT_AUTHORIZED = Object sent without proper authorization. The plug-in retries these events, so by default the system does not clean this status code.
Different statuses are useful at different stages of integration. In development, you might wish to disable this cron job so you can easily review all events. When the site is in testing or production, set the config setting to ACCEPTED only.
Visitor tracking
If you use the accelerator and base your implementation on an existing YaaS storefront that comes with the YaaS installation, the extension can leverage commerceinsights.tag to access front-end events with minimal effort required from you. As part of your installation process, the commerceinsights.tag file copies to:
/ext-template/yacceleratorstorefront/web/webroot/WEB-INF/tags/shared/analytics/commerceinsights.tag
or,
/ext-template/yacceleratorstorefront/web/webroot/WEB-INF/tags/analytics/commerceinsights.tag
The installation also copies associated support files. This file executes standard visit tracking events such as page views, order success confirmations, and marketing attribution, in addition to visitor events. The installation also patches all enabled accelerator-like extensions for you. Revert this with a make clean command.
The Commerce Install extension for EC does fundamental tasks to enable Commerce Insights on your EC installation and send data to the YaaS Commerce Insights solution for processing:
- Installs Event Listeners - The plugin utilizes event interceptors to detect event changes on key data types and changes in the EC platform. By default, it includes listeners for products, orders, carts, and customers.
- Installs Data “Mapper” - The extension uses a series of customizable data maps to normalize your event data to the expected Commerce Insights API specifications, both for ongoing real-time event handling and historical data retrieval.
- Installs commerceinsights.tag file - The extension supplies a tag file and associated support classes to capture data about your customers' browsing activity.
- Initializes “Heartbeat” - The extension utilizes a “heartbeat” beacon so that the solution's monitoring services can ensure that your installation is active and functioning. The service reports whether the system is still operational, even if the platform is not receiving data. A cron job installed for every node leverages the hybris node ID.
Considerations
Configure your order map and filter to allow all orders you want to report on. Use a query similar to the following to find them:
SELECT {s:code}, COUNT(*)
FROM {Order AS o}, {OrderStatus AS s}
WHERE {o:status} = {s:pk}
GROUP BY {s:code}
Then make sure that every order status your filter allows through the order map translates every order status into either accepted or cancelled.
Production-ready checklist
If you followed the installation instructions to this point, you are ready to launch Commerce Insights into production. Here is a final checklist to make sure you finished all the required steps:
- Change the site id and OAuth credentials to production values. Make sure you are not still using your test or stage authentication credentials and site id.
- Check that all respective elements of the local.properties file are completed as outlined in the documentation.
- Check that all four cron jobs are enabled.
- The data cleanup job commerceinsights.cronjob.cleanUp.statuses is set to only clean
ACCEPTEDevents. - You see the Commerce Insights JavaScript loaded on your YaaS storefront pages for visit tracking, and you completed any custom JavaScript to track custom variables.
- The HMC status page shows that:
- Interceptors enabled.
- Cron jobs enabled and running as expected.
- Connection status is
okfor the monitored sites, and the site names are correct. - Synchronization status does not show any rejected events.
- You completed your historical sync of data to the Commerce Insights solution.
- Check your Commerce Insights dashboard to make sure the reports show valid data.
Uninstall Commerce Insights
If you decide to uninstall Commerce Insights, follow these instructions to clean up your EC installation:
- Go to /opt/hybris/platform/bin and run
source ./setantenv.sh; ant clean. - Remove references to commerceinsights in ${hybris}/config/localextensions.xml.
- Go to /opt/hybris/platform/bin and run
source ./setantenv.sh; ant all. - Run
updatein the EC Admin Console (ECAC). - Restart EC.
- Optional:
- Remove the Commerce Insights extension.
- In ECAC, go to maintenance → cleanup. Flag all the Commerce Insights objects for deletion. Remove them if desired.
- Go to hybris sql box and drop all comminsights tables.
- Remove any optional JavaScript added to the YaaS storefront pages during integration.
Javascript Tracking
This step is required if you are implementing the Commerce Insights package for a custom API implementation or non-SAP Hybris Enterprise Commerce (EC) implementation. The instructions that follow outline how to configure your site with Commerce Insights's JavaScript event tracking. Any customer implementing the package for the EC platform should note that the JavaScript tag file is included in the plug-in under the name commerceinsights.tag.
Event tracking implementation
Before you load or trigger the Commerce Insights JavaScript library, you need your site's ID number and the URL of the tracker. You can obtain both by calling the config endpoint of the Commerce Insights Event API. Use the site_id and tracker_url the service returns. If you have multiple sites, the tracker_url is the same for all sites, but the site_id is different for each. Retrieve the site_id and tracker_url once, at application startup. There is no need to retrieve them for each page load.
Pageview tracking
Place the code in the element of your HTML. Commerce Insights's JavaScript library loads asynchronously to avoid impacting your site's page load time. Place the code on every page that you want Commerce Insights to track. Set the ${ciSiteId} variable with your commerce_insights_site_id. You can leave the commerce_insights_org_id variable as an empty string, as shown. Set ${ciSiteId} and ${ciTrackerUrl} with the values obtained from the config endpoint described previously. Use the templating features that your environment provides to insert these values into the JavaScript template.
(function(){
    var d=document,g=d.createElement('script'),s=d.getElementsByTagName('script')[0];
    g.type='text/javascript';g.defer=g.async=true;g.src=d.location.protocol+'//${ciTrackerUrl}';
    s.parentNode.insertBefore(g,s);
})();
var commerce_insights_site_id = "${ciSiteId}";
var commerce_insights_org_id = "";
If you perform your own integration, note the following rules when going through the examples:
- Do not hardcode the beacon URL. Get it from the Commerce Insight Event API's
configendpoint. - Do not use the YaaS site ID or name, which is usually
default. Use the site_id from the config endpoint.
Examples by pagetype
There are three steps to sending a correct pageview event:
- Set the page type - Set this variable to one of the following values:
product,category,search,order_success,cart, orother. Write your own conditional code to identify what type of page the visitor is on, and set this variable accordingly. - Set the data object - The data object contains additional metadata about the pageview. By default, this object contains the customer's ID, if known. The other required properties depend on the page type of the pageview, covered in the next section.
- Send the pageview to Commerce Insights - Send the pageview to Commerce Insights. Explicitly call
beacon_api.pageview(commerce_insights_org_id, commerce_insights_site_id, type, data)to send the pageview event to Commerce Insights. Because this call exists in the deferred function, it sends asynchronously.
Product
Include the logic in the code shown within the beacon_deferred function, and not outside. Include the code on every page you want to track.
function beacon_deferred(beacon_api){
  var type = "product";
  data.product = {
    product_code: "ADDIDAS_PURE_BOOST_CLIMA",
    name: "Pure Boost Clima Shoes",
  }
  beacon_api.pageview(commerce_insights_org_id, commerce_insights_site_id, type, data);
}
product_code - The product code of the product. Use the product code of the parent product, such as Nike Air Jordan sneakers, and not the product code of a variant such as
size 6 red.name - The name of the product
Search
function beacon_deferred(beacon_api){
  var type = "search";
  data.search = {
    term: "pure boost shoes",
    total_results: "23",
    page: "1",
  }
  beacon_api.pageview(commerce_insights_org_id, commerce_insights_site_id, type, data);
}
- term - The search term
- total_results - Number of products the search returns
- total_results - Page number of search results
Category
function beacon_deferred(beacon_api){
  var type = "category";
  data.category = {
    name: "2014 Nike Air Jordan Sneakers"
  }
  beacon_api.pageview(commerce_insights_org_id, commerce_insights_site_id, type, data);
}
- name - Name of the category
Order success
function beacon_deferred(beacon_api){

  var type = "order_success"; // No additional data properties needed

  /* However, you do need to send an "order success" event with
  the order number. This is the human-readable order number,
  not the system ID of your orders table */
  beacon_api.order.success(commerce_insights_org_id, commerce_insights_site_id, {
    order: { num: "000012" }
  });
  beacon_api.pageview(commerce_insights_org_id, commerce_insights_site_id, type, data);
}
Visits
This implementation is straightforward. Set the data.attribution property with the result of the beacon_parseAttribution function, which is provided as part of the Commerce Insights JS library that you already asynchronously loaded. The beacon_parseAttribution function accepts an array containing your URL parameter names.
function beacon_deferred(beacon_api){
    var type = "..."; // Set these variables per early instruction
    data = {...}
    data.attribution = beacon_parseAttribution(['ach', 'asch', 'asrc']);
    beacon_api.pageview(commerce_insights_org_id, commerce_insights_site_id, type, data);
}
- data.attribution - Can be any length, however the Marketing report only drills down to a maximum of five levels.
When you set the data.attribution property, Commerce Insights’s JavaScript saves this property to a browser cookie. Every subsequent event sent through the JavaScript Event API within the same visit automatically appends with this attribution array. After the initial pageview, the attribution property either should not be set or, alternatively, set to an empty array [ ]. In both cases, the system does not reset the attribution. View more details in the Tracking section.
Other
function beacon_deferred(beacon_api){
  var type = "other"; // No additional data properties needed
  beacon_api.pageview(commerce_insights_org_id, commerce_insights_site_id, type, data);
}
Use this page type for any pages that do not fit the previous types. In your conditional code, make Other your catch-all category.
Closing JSP script
<%@ tag body-content="empty" trimDirectiveWhitespaces="true" %>
<%@ taglib prefix="c" uri="http://java.sun.com/jsp/jstl/core"%>
<%@ taglib prefix="fn" uri="http://java.sun.com/jsp/jstl/functions" %>

<c:if test="${not empty ciSiteId}">
<script type="text/javascript">

/* Commerce Insights snipped from above */
(function(){
  var d=document,g=d.createElement('script'),s=d.getElementsByTagName('script')[0];
    g.type='text/javascript';g.defer=g.async=true;g.src=d.location.protocol+'//${ciTrackerUrl}';
    s.parentNode.insertBefore(g,s);
})();
var commerce_insights_site_id = "${ciSiteId}";
var commerce_insights_org_id = "";

function beacon_deferred(beacon_api){
  var data = {
    customer: {
      id: "${user.uid}",
      firstname: "${user.firstName}",
      lastname: "${user.lastName}",
      email: "${user.uid}"
    }
  };

  data.attribution = beacon_parseAttribution([
    "commerce_insights_atr1",
    "commerce_insights_atr2",
    "commerce_insights_atr3",
    "commerce_insights_atr4",
    "commerce_insights_atr5"
  ]);

    <c:choose>
      <c:when test="${pageType == 'PRODUCTSEARCH'}">
        var type = "search";
        data.search = {
          "term": "${searchPageData.freeTextSearch}",
          "total_results": "${searchPageData.pagination.totalNumberOfResults}",
          "page": "${searchPageData.pagination.currentPage + 1}"
        };
      </c:when>

      <c:when test="${pageType == 'PRODUCT'}">
        var type = "product";
        data.product = {
          "product_code":  "${product.code}",
          "name": "${product.name}"
        };
      </c:when>

      <c:when test="${pageType == 'CATEGORY'}">
        var type="category";
        data.category = {
          "name": "${categoryName}"
        };
      </c:when>

      <c:when test="${pageType == 'CART'}">
        var type="cart";
      </c:when>

      <c:when test="${pageType == 'ORDERCONFIRMATION'}">
        beacon_api.order.success(commerce_insights_org_id, commerce_insights_site_id, {
          "order": {
            "num":  "${orderData.code}"
          }
        });
        var type="order_success";
      </c:when>

      <c:otherwise>
        var type = "other";
      </c:otherwise>
    </c:choose>

    beacon_api.pageview(commerce_insights_org_id, commerce_insights_site_id, type, data);
}

</script>
</c:if>
Enhanced visitor tracking
Commerce Insights automatically parses a visit’s landing URL and referring URL to determine where the visit came from, based on a list of rules. Any subsequent orders and revenue resulting from the visit attribute to the visit’s referring source. For some merchants, this is sufficient, makes it easy to start, and requires no additional configuration.
However, if you currently employ URL parameter tracking to track inbound marketing attribution, you can still use your tracking parameters instead of relying on Commerce Insights’s standard business rules. Your marketing attribution reports will then reflect this. The following sections show how to implement this functionality.
Implementation
Commerce Insights includes a section for customer marketing attribution in the commerceinsights.tag file provided to you with your installation. This code extracts specific URL parameters from your pageviews and saves these to the attribution property of the pageview’s metadata (the data object). If you set this property, this custom attribution takes precedence over the default Commerce Insights attribution business rules.
The following is an extract from the commerceinsights.tag file. There is a block of instructional comments, followed by an active line of code setting the data.attribution property in the commerce_parseAttribution function. Pass in an array of URL parameters to extract from the URL. Array position is important, and is interpreted left-to-right, as least specific (highest-level attribution) to most specific.
// extract from http://www.store.com?atr1=email&atr2=newsletter&atr3=2013-05&atr4=cta_button
data.attribution = commerce_parseAttribution(['atr1', 'atr2', 'atr3', 'atr4']);

// and set data.attribution to the following...
data.attribution = ['email', 'newsletter', '2013-05', 'cta_button'];
data.attribution = commerce_parseAttribution(['commerce_atr1', 'commerce_atr2', 'commerce_atr3', 'commerce_atr4', 'commerce_atr5']);
Notice that the commented example looks for URL parameters such as atr1, atr2, whereas the active line of code looks for commerce_atr1, commerce_atr2 respectively. This is to stress that these URL parameters are defined by you and your marketing team. Set any number of levels (array length) of attribution, however Commerce Insights reports only drill down to a maximum of five levels.
After you set the data.attribution property, Commerce Insights’s JavaScript saves this property to a browser cookie. Every subsequent event sent through the Javascript event API within the same visit appends with this attribution array. After the initial pageview, the attribution property is either not set or sets to an empty array [ ]. In both cases, the system does not reset the attribution.
Set the attribution property
commerce_parseAttribution() function on every pageview. If you followed the preceding implementation example, this happens automatically.The following sequence shows a hypothetical attribution flow as a customer visits URLs throughout your store, and demonstrates how the commerce_parseAttribution() function handles visits that do and do not follow the observable ja# argument convention.
- The customer starts at http://www.store.com?ja1=email&ja2=newsletter&ja3=2013-03. The function
commerce_parseAttribution(['ja1', 'ja2', 'ja3'])sets the attribution property to['email', 'newsletter', '2013-03']. A pageview event transmits with this property set and from this moment on, the visit is associated with this attribution. - The system saves this property to the browser cookie, and attaches it to every subsequent event that occurs during the visit.
- The customer then visits http://www.store.com/categories/dresses. The function
commerce_parseAttribution(['ja1', 'ja2', 'ja3'])responds by setting the attribution property to an empty array[], since no attribution keys such as ja1 and ja2 are found in the URL query string. If the Commerce Insights beacon sees a missing or empty attribution array, it knows not to reset your attribution to an empty array. All subsequent events append with['email', 'newsletter', '2013-03']. commerce_parseAttribution()goes back to waiting for subsequent URL visits and handles them in one of the aforementioned ways, depending on the URL query.
During setup, do not choose custom URL attribution parameter keys that you reuse for other purposes on your store. This causes commerce_parseAttribution() to reset the attribution property whenever it sees those keys. This associates subsequent events with attribution values that are nonsensical and related to internal use cases rather than attribution.
If some of your visits have custom attribution (URL parameters exist) and some visits do not have custom attribution (URL parameters do not exist), the visits without custom attribution fall back on the Commerce Insights default attribution rules. For example, direct visits to your store generally lack URL parameters, and fall back on Commerce Insights default rules, which assign the visit to the Direct channel.
New custom attribution property
The new custom attribution property begins a new visit. In the middle of an existing visit, if Commerce Insights’s beacon sees a new pageview with a different, non-empty attribution string, Commerce Insights ends the current visit and starts a new visit. The following customer visit sequence provides an example of this functionality:
- A customer visit to http://www.store.com?ja1=email&ja2=newsletter&ja3=2013-03 creates a new visit with the attribution ['email', 'newsletter', '2013-03'].
- The customer then visits http://www.store.com/categories/dresses. This counts as a continuation of the previous visit so attribution remains the same.
- Finally, the customer leaves the store and comes back through AdWords via the URL
http://www.store.com?ja1=sem&ja2=adwords&ja3=canada&ja4=shoes. The system sees a new attribution array and the beacon ends the current visit and starts a new visit with the attribution['sem', 'adwords', 'canada', 'shoes'].
Considerations
A few suggestions and common parts of the process that might make the process easier:
- The product code is the same product code that you send in your back-end product objects.
- The order number in your order success JavaScript must match the order number in your back-end order event.
- You must pass the respective page types for each page. See the pagetype reference for page types.
- Do not use attribution parameters that you reuse for other purposes on your store. For example, p is often used for page number, for example
?p=2. You do not want your attribution to set to2every time someone views the second page of your catalog or search results. - Visits with landing URLs that do not contain your custom URL parameters fall back on Commerce Insights's default attribution rules.
- To implement more complicated custom attribution tracking, for example, some combination of URL parameters and custom URL business rules, such as URL parsing and domain matching, reach out to your Commerce Insights Professional Services contact.
- A pageview that sets new custom attribution values ends the current visit and starts a new visit.
Merchandise CSV Setup
Uploading a Merchandise CSV allows Commerce Insights to provide you with powerful analytics around your merchandising categories, their products, and merchandising roll-up reporting. Setting up your merchandising categorization is a requirement to enable Commerce Insights’s merchandising reports. Most merchants already have the required mapping in their internal systems. It is just a matter of passing this information to Commerce Insights and keeping it in sync.
Your merchandisers, merchandise planners, and buyers use your merchandising categories. This is most likely not the same as the categories such as site taxonomy that you set up on your e-commerce site.
The merchandising categories you load into Commerce Insights must adhere to these rules:
- Every product has only one parent category.
- Every category has only one parent category.
- Every category can have one or more child products and/or categories.
Finally, Commerce Insights needs to have the product → category and category → parent category relationships across your catalog.
The columns of the CSV are as follows:
- Column 1: Product Code - This is the product code, not the SKU code. For example, if you are selling Nike Air Jordan Sneakers, provide the product code of the Nike Air Jordan Sneakers product.
- Column 2: Prodct Name - The name of the product, for example, Nike Air Jordan.
- Column 3: Full Category Path - This is the category path the product belongs to. This path includes the parent category and all ancestor categories until reaching a top-level category.
Example CSV file
| Product Code | Product Name | Full Category Path |
| 11054 | New Balance 620 | Women/Shoewear/Sneakers |
| 11075 | VINCE crewneck sweater | Men/Sweaters |
| 11092 | LEGOs | Children/Toys/Action Figures |
Update your CSV file
Follow these instructions to update your CSV file.
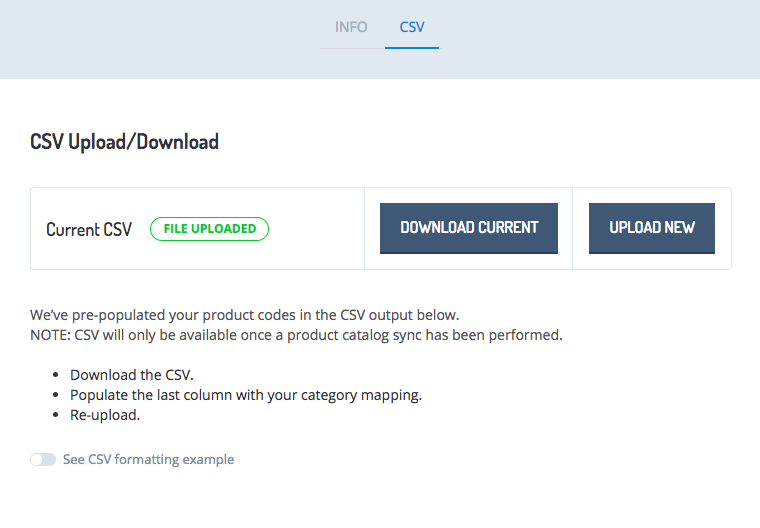
- In the Builder, select your project.
- Click Commerce Insights.
- Click Settings.
- Click the CSV tab.
- Click Download Current.
- Fill in the last column, Full Category Path.
- In Settings, click Upload New and select your updated file. The system processes the CSV overnight.
General UI / Features
The following sections outline the general UI features that are helpful as you navigate the various Commerce Insights reports.
Date selector
Located on the top right of the Commerce Insights application, the date selector allows you to pick the time range for displaying report data. Each report, with the exception of the Realtime Dashboard, uses this range to display data over the defined time period. There are a number of preset date ranges to choose from, as well as preset comparison periods.
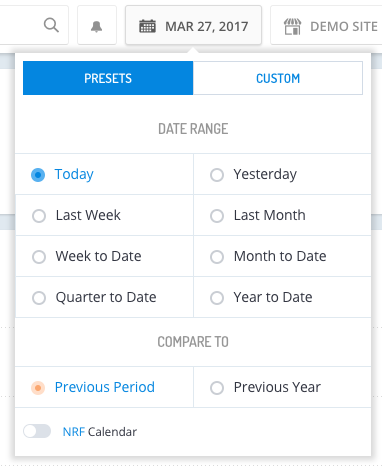
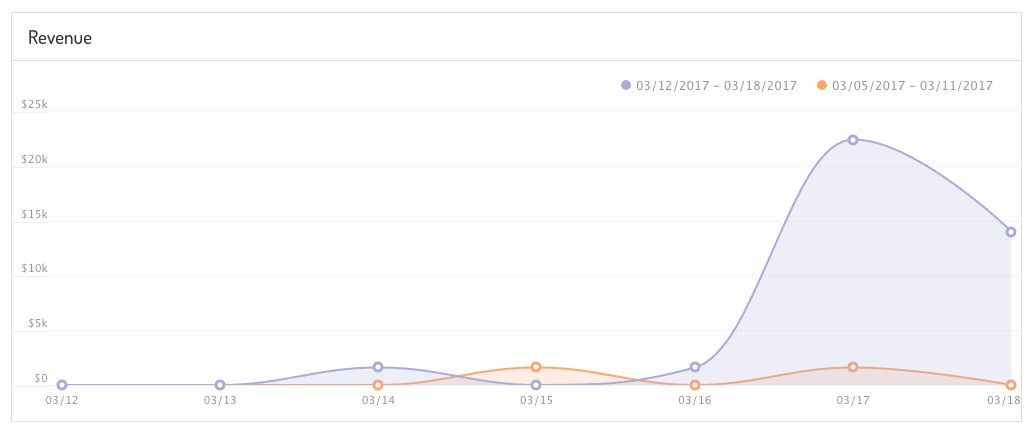
If the presets are not ideal, set your own on the Custom tab. You can also compare reports to a previous date range. For example, the revenue chart displays the current month-to-date alongside the previous month within the same time period. When you select a Compare To period, the current period appears in purple and the comparison period appears in orange.
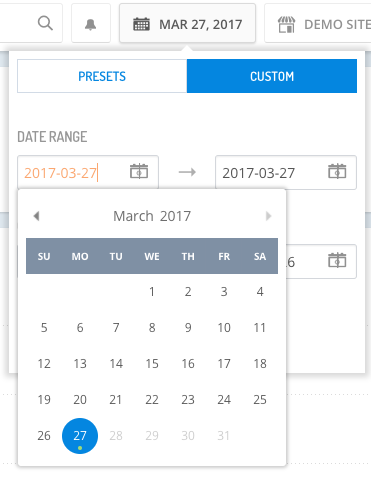
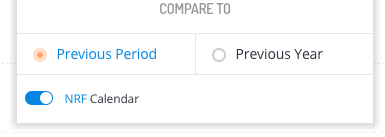
Finally, depending on how your data is set up, it might make sense for you to use the NRF calendar dating system. To turn this on, toggle the NRF Calendar switch on the bottom left of the date menu.
Commerce Insights application search
Search is available on any report and you can use it to quickly jump to a customer, order, or product.
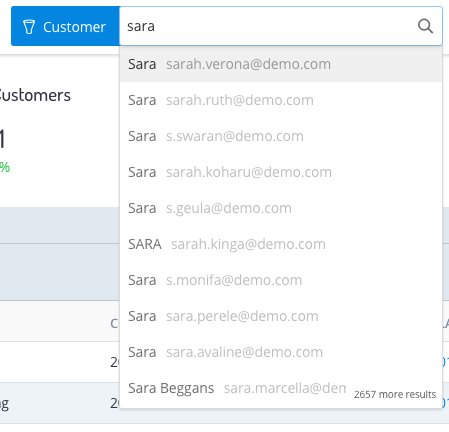
- Customers - Search by any part of a name, customer ID, or email.
- Products - Search by product name.
- Orders - Search by order ID, for example 123457.
To change the search category, click the blue section that appears when you click in the search field. The search runs after you type a third letter. Results show the ten most relevant results along with a counter indicating number of remaining results.
Timestamp
Commerce Insights includes a timestamp at the bottom of each report, which displays the last time the report or data updated. Make time zone changes or updates by navigating to the Settings section in the Builder.
In the image, the timestamp reads 9:00 AM EST. The reports include data up to 9:00 AM EST and the report does not reflect any activity that took place after 9:00 AM EST. The Insights reports run on a weekly and monthly basis.

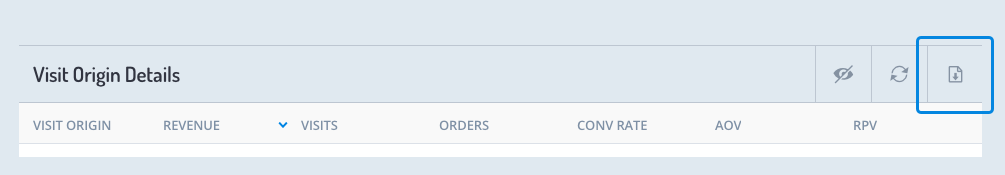
Download CSV reports
To give merchants control over their e-commerce data, Commerce Insights has a reporting and insights download feature. This feature allows merchants to download data in CSV format. From there, merchants can easily sort, slice, dice, and share important marketing, merchandising, and customer data. This feature makes it easy to do things like download lists of Best Customers, Customers at Risk, and High Lifetime Value Customers and then upload the reports into a marketing automation system for follow-up campaigns.
- Click the download icon enabled on any table within the application.
- A message pops up to let you know your file is preparing.
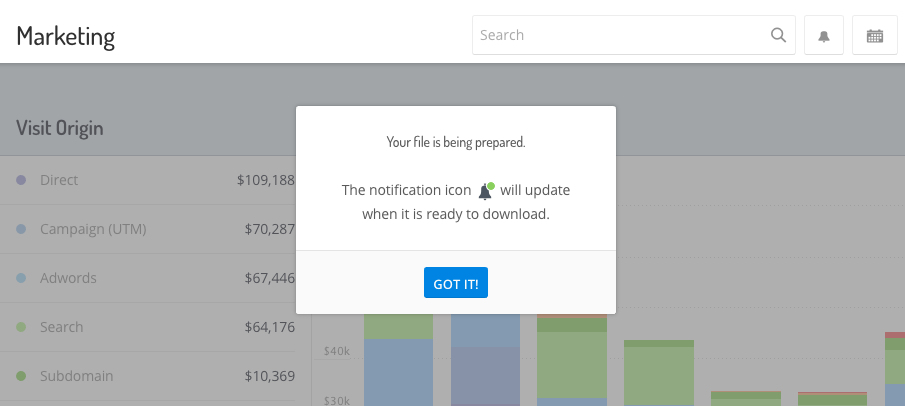
- Notifications display at the top of the page when the data is ready for download, as well as previous download requests.
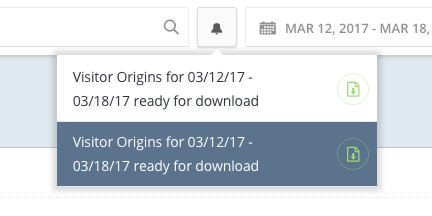
- Select the file to download. The application keeps the files that are ready for download in the notifications list for the duration of your browser session.
Site settings
Your site settings are in a separate, side navigation link in the Builder. The Settings view has two tabs, Info and CSV.
Click Info to view the Site Info. The available fields for Site Info are:
- Name - The name of your site
- Site Url - Your site's URL
- Timezone - The timezone for the site, which effects calendar ranges across reports
- Currency ISO - The currency type for report metrics such as revenue
- Blocked IPS - IPs to block from your site
The CSV tab allows you to view or upload a CSV file that maps your products to the application catalog. When setting up a new site, odds are the product CSV won't be filled out in its entirety, or at all, so one of the early steps in the setup is to visit this page and make sure a properly-formatted CSV is uploaded.

Dashboard
The Commerce Insights Dashboard report provides a high-level summary of key metrics that make it easy to keep a pulse on your business.
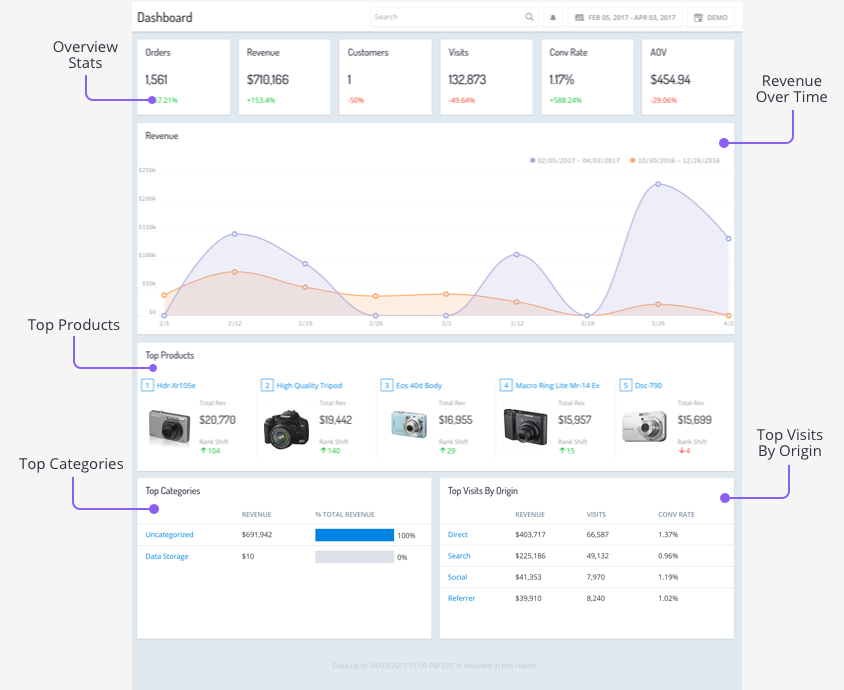
General statistics
The top line of the Dashboard shows your store’s key metrics. Each box displays the total value and percentage of change for the statistic over the selected date range.
| Metric | Description | Calculation |
|---|---|---|
| Orders | Number of completed orders | sum of completed orders |
| Revenue | Sum total of money from completed orders, converted into one currency, minus revenue lost to refunds and returns | sum (revenue from completed orders) - sum (returns + refunds) |
| Customers | Number of unique individuals who made an order | sum customer IDs with at least one order |
| Visits | Total number of visits. This does not reflect unique visitors. | sum visits |
| Conversion Rate | Percentage of visits that resulted in a completed order | completed webstore orders / visits |
| AOV | Average cart value of each completed order, not including returns and refunds | revenue / (completed orders - returns + refunds) |
Revenue graph
The Revenue graph displays total revenue over the selected period of time, and compares it to revenue from the previous period. You can view exact values by hovering your cursor over a specific data point. Revenue displays in your store’s default currency, which you can set within the Commerce Insights settings.
| Metric | Description | Calculation |
|---|---|---|
| Revenue over Time | Revenue over a given time period (one day in observed period: hourly)(more than one day in observed period: daily) | sum (revenue from completed orders) - (returns + refunds) |
Top products
This snapshot shows the top five revenue-grossing products for the current date range. Each product also links to its respective merchandising product report where you can view the performance of the product over time. The number shown in green or red represents, respectively, how many ranks the product moved up or down during the comparison period.
| Metric | Description | Calculation |
|---|---|---|
| Product Ranking | Products ranked according to gross revenue over a given time period | sum line item sale price of item for all completed orders that include the product (does not include shipping or tax) - (returns of this product + discounts on the product + refunds for the product) |
| Product Revenue | Sum sale price of a given product, minus discounts, returns, and refunds over a given time period | sum line item sale price of item for all completed orders that include it (does not include shipping or tax) - (returns of this product + discounts on the product + refunds for the product) |
| Product change in ranking | The change in the product's ranking from the observed period to the compare periods | observed product ranking - compare product ranking |
Top categories
Top Categories shows the top-grossing categories across your product catalog, as well as the percentage of each when considering all of the categories.
| Metric | Description | Calculation |
|---|---|---|
| Top Category Revenue | Merchandise categories by total revenue | sum of revenue across observed dates |
| Percentage of Total Revenue | Amount of revenue this category accounts for considering the whole | (sum all category revenue / specific category revenue) |
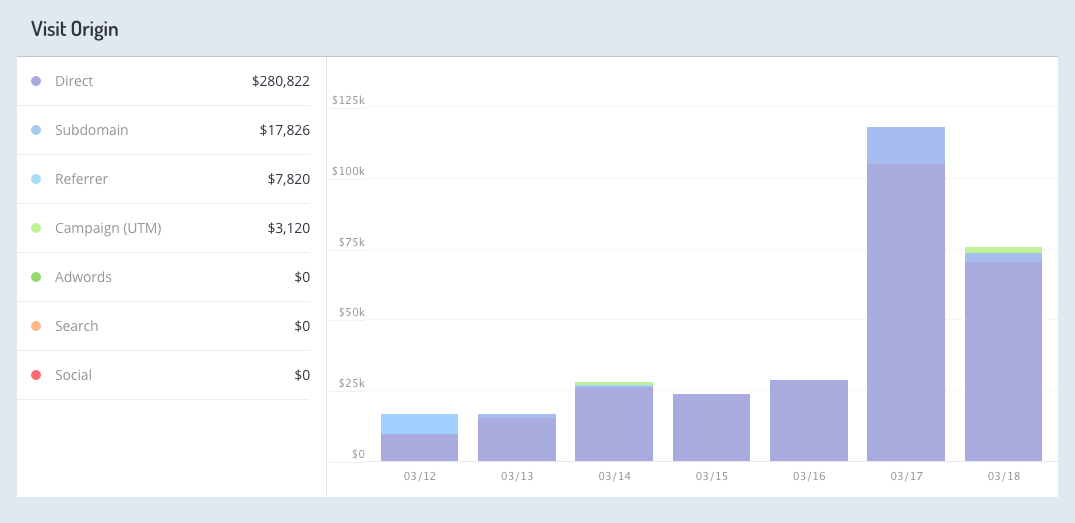
Top visits by origin
Top Visits by Origin provides an overview of your marketing channels. It also shows which channels drive the most visits and revenue, and which generate the highest conversion rates. Each channel shown links to the Marketing report.
| Metric | Description | Calculation |
|---|---|---|
| Visit Origin Ranking | Visit origins ranked according to visits | sum visits from visit origin |
| Visit Origin Visits | Visits that came from a given visit origin | sum visits where referrer = a given visit origin |
| Visit Origin Conv. Rate | Percentage of visits that resulted in an order for a given visit origin | (sum orders where referrer = a given visit origin) / (sum visits where referrer = given visit origin) |
| Visit Origin Revenue | Sum of all revenue from visits that came from a given visit origin | sum (revenue from completed orders where referrer = a given visit origin) - sum (returns and refunds from the same visit origin) |
Realtime
The Realtime report provides you with immediate insight into how your store is performing. It displays total revenue, the number of items sold, total orders, and the number of visits. It also includes a real time stream of geolocation data so you can see what regions are driving sales.
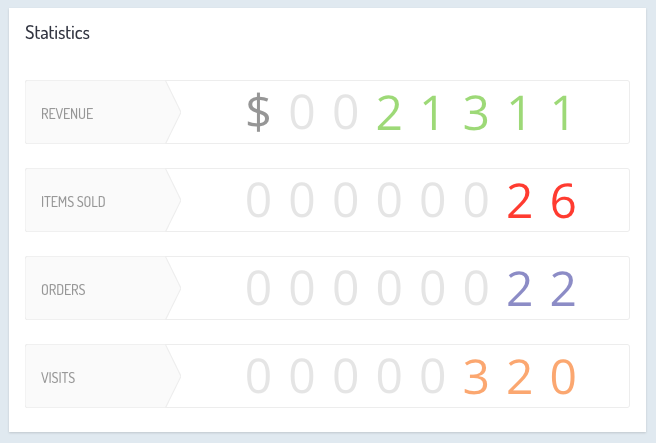
Statistics
A realtime feed of top-level storewide metrics such as revenue and items sold tallied up as of 12 AM on the current day in your current timezone, as defined in your site settings.
| Metric | Description | Calculation |
|---|---|---|
| Revenue | Total revenue, up to the minute | sum (revenue from completed YaaS store orders) - sum (returns + refunds) |
| Visits | Total visits to the site, up to the minute | sum visits |
| Orders | Total YaaS store orders, up to the minute | sum completed YaaS store orders |
| Items Sold | Total quantity of items sold, up to the minute | sum (for each order sum (line item * qty)) |
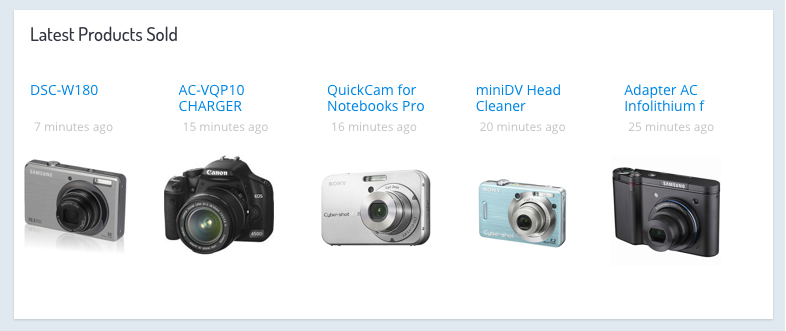
Latest products sold
The Latest Products Sold data includes a revolving carousel of the five most recently sold products. You can click the name of the product to visit that product’s Merchandising report.
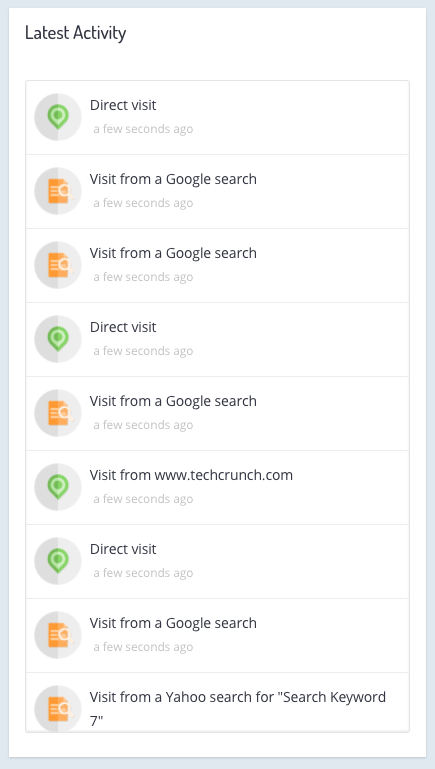
Latest activity
The Latest Activity stream displays a live stream of visits to your store. This includes information on the visit origin, any keywords used, and how long ago consumers visited.
Marketing
The Marketing report summarizes visitor data to help marketing managers gain a better understanding about which channels provide the best returns. Monitor which channels drive the most visits, orders, the best conversion rate, average order value (AOV), and revenue per visit (RPV).
Visit origin by revenue
Understanding how each visit origin contributes to total sales is important when deciding where to spend your marketing dollars. Monitor how each visit origin is trending to measure the impact of any changes in your marketing actions and how it affects your revenue. The trends from these metrics can also help you predict future behavior.
| Metric | Description | Calculation |
|---|---|---|
| Direct | Visits to the site that originated directly from typing the website address | sum (revenue from orders where referrer equals direct) |
| Search | Visits to the site due to search engine traffic, such as Google | sum (revenue from orders where referrer equals Search |
| Social | Visits sourced from social media channels such as Facebook, Twitter, Pinterest, LinkedIn, Instagram, or Tumblr | sum (revenue from orders where referrer equals Social) |
| Campaign (UTM) | Revenue from visits that resulted as a click through from an ad placement tagged with UTM | sum (revenue from orders where referrer equals Campaign (UTM)) |
| AdWords | Revenue from visits from an AdWords ad, tagged with GCLID | sum (revenue from orders where referrer equals AdWords) |
| Referrer | Revenue from visitors that came as a result of a referral from another website | sum (revenue from orders where referrer equals Referrer) |
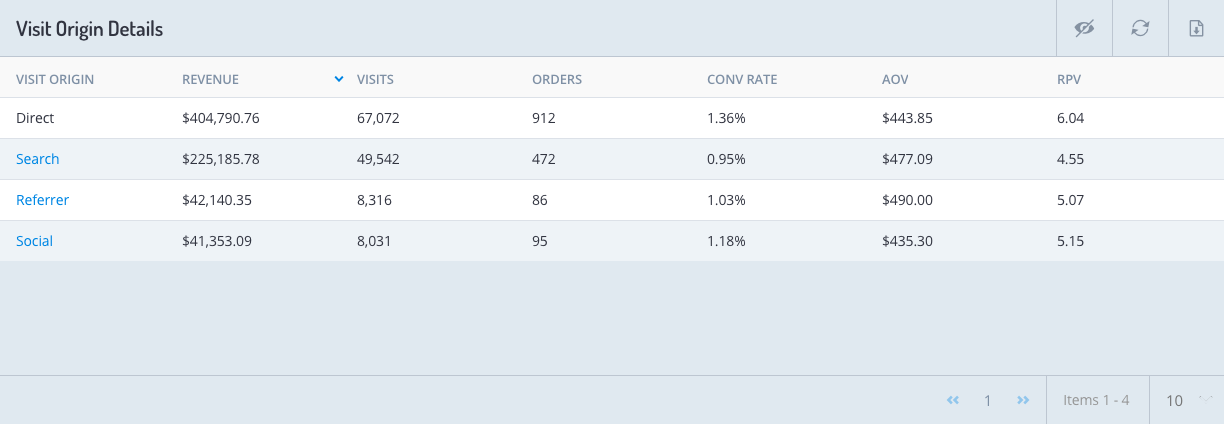
Visit origin table
This table aggregates visit data by visit origin including key metrics such as revenue, visits, orders, conversion rate, AOV, and revenue per visit (RPV). Sort the table by any of these key metrics to identify the most productive channels. Filter the data by any channel to drill down deeper and see what exactly drives each visit.
| Metric | Description | Calculation |
|---|---|---|
| Revenue | Revenue from orders where the visit originated from a given referrer for a specified time period | sum (revenue from orders where the visit originated with the given referrer) |
| Visits | Visits for a given referrer over a specified time period | sum (visits that came from the referrer) |
| Orders | Orders where the visit originated from a given referrer for a specified time period | sum (orders where the visit originated with the given referrer) |
| Conversion Rate | Percentage of visits that resulted in orders for a given referrer for a specified time period | sum (orders where the visit originated with the given referrer) / sum (visits that came from the referrer) |
| AOV | Average order value for all YaaS store orders from a given referrer for a specified time period | sum (revenue from orders where the visit originated with the given referrer) / sum (orders where the visit originated with the given referrer) |
| RPV | revenue per visit for a given referrer for a specified time period | sum (revenue from orders where the visit originated with the given referrer) / sum (visits that came from the referrer) |
Merchandising
The Merchandising report provides insight into which products and categories are performing, faltering, and indicating potential for future investment. Ultimately, much of e-commerce success relies on having the right product assortment. The Commerce Insights solution demonstrates your products’ strengths and weaknesses so you know where to focus and where to improve.
The service's merchandising analytics are based on your one-to-one, product-to-category mapping. Each product has only one parent category, though each category can have multiple subcategories and products. Every category and product has its own report, giving you insight into how it is performing and what exactly drives that performance.
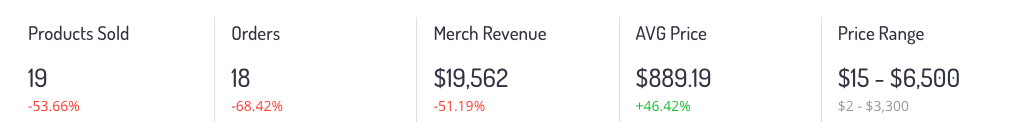
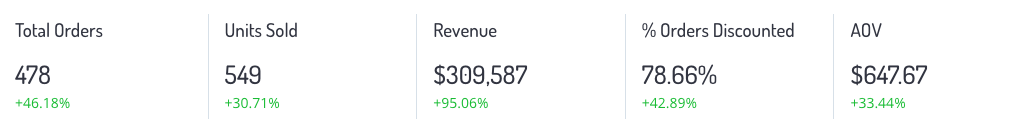
Merchandising statistics
These statistics only take product-level information into account, so they differ from the top line statistics you see on other pages like the dashboard. The revenue takes product-level discounts into account, but not order-level discounts.
Checking this report daily gives you a deeper understanding about the sales performance of each category. The ratio of products to orders helps you gauge product mix and the diversity of products sold. Monitoring average price can point out any changes in price and the efficacy of your discounts. Compare this metric against revenue to gauge any price sensitivity among your customers. For example, if revenue increases and average price decreases, it may suggest that customers buy more products at lower price points and are price-sensitive.
| Metric | Description | Calculation |
|---|---|---|
| Products Sold | The number of products sold in your store during your selected date range | sum (products included in completed orders) |
| Orders | The number of orders placed during your selected date range | sum (orders with at least one product) |
| Merch Revenue | The total amount of revenue from your merchandise. This amount includes product-level discounts, but does not take shipping, taxes, or order-level discounts into account. | (sum (line item sale price - order level discounts) qty)) - (sum (line item price for returned + refunded products from orders in the time period) qty)) |
| AVG Price | The average (mean) price of your products ordered | (sum line item prices of products in all completed orders) / total quantity of products |
| Price Range | The highest and lowest prices of products ordered | lowest sale price of an item purchased, including discounts, and highest sale price of an item purchased |
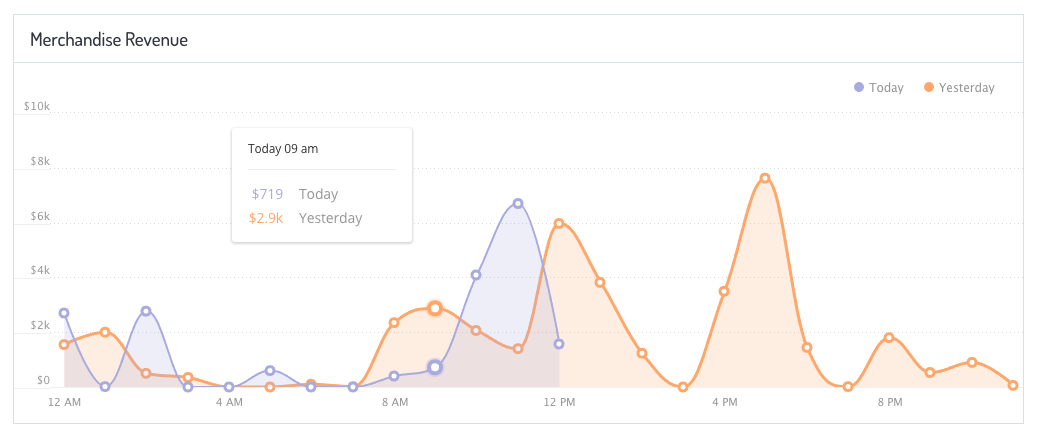
Revenue graph
The Merchandise Revenue graph shows how your merchandise revenue changes over time based on your selected date range. The graph in purple shows the revenue for your current date range, and the graph in orange represents the revenue from another date range you select for comparison.
Products table
The Products table helps you quickly understand some very important data about the best- and worst-selling products, the fastest- and slowest-growing products, and the most- and least-visited products. Monitoring this report is key to understanding what your customers purchase and view, and is a great tool to help you plan product assortments for future collections. Click a column name to change how the list sorts, or click on a product name to see the individual product report.
| Metric | Description | Calculation |
|---|---|---|
| Merch Revenue | The revenue from units of the product sold within the provided date range | (sum (line item sale price - order level discounts) * qty)) |
| Orders | The total number of orders that include the product within the provided date range | sum (completed orders that include this product as a line item) |
| QTY Sold | The quantity of the product sold within the provided date range | sum (qty of products in completed order) |
| Visits | The number of page views the product received within the provided date range | sum (pageviews of this product page) |
Merchandising SKU table
Click the SKUs tab to view the SKU merchandising report. This report shows all of your store's SKUs in a table, sorted by your top revenue producers, in addition to the top line statistics and revenue graph provided from the product report.
Click a column name to change the sort order, or use the icons in the top-right corner to hide columns, restore the table to its original format, or export the report. Click the name of a product to view the individual product report.
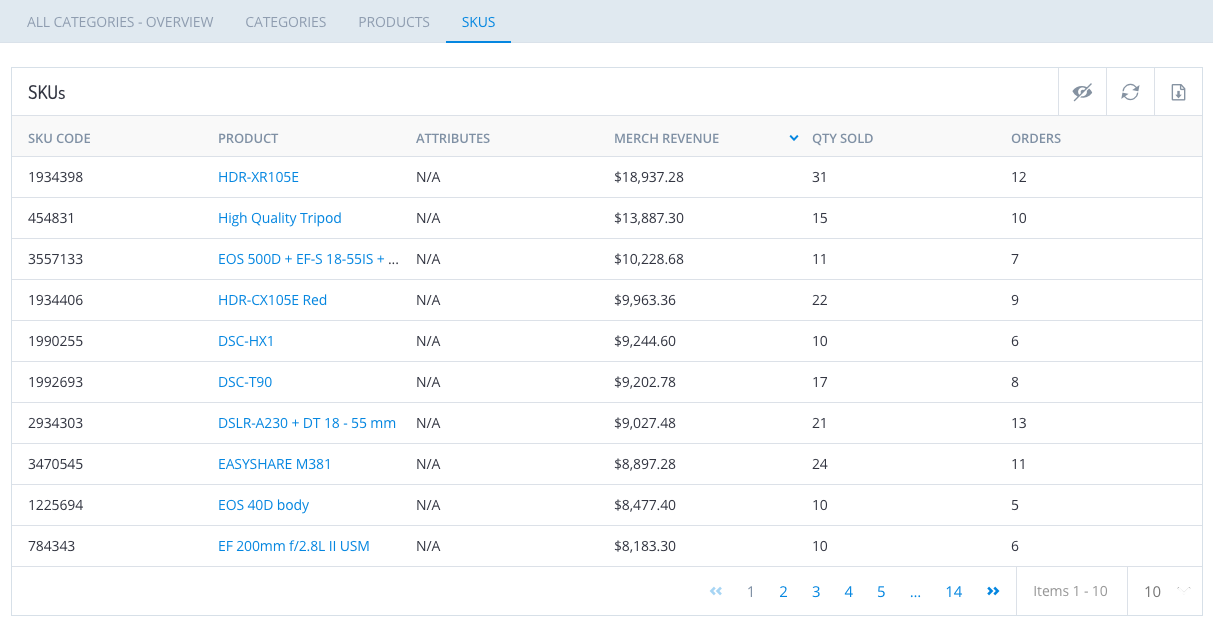
The first three columns in the report provide these details:
- SKU Code - The SKU code assigned to the product variant
- Product - The product's name; click a product name to view the individual product report
- Attributes - The product variant, meaning the available options for a single product
This table describes the calculations used in the SKU merchandising report.
| Metric | Description | Calculation |
|---|---|---|
| Merch Revenue | The revenue from units of the product sold within the provided date range | (sum (line item sale price - order level discounts) * qty)) |
| QTY Sold | The quantity of the product sold within the provided date range | sum (qty of products in completed order) |
| Orders | The total number of orders that include the product within the provided date range | sum (completed orders that include this product as a line item) |
Product detail
Products are the atoms of the merchandising section. All categories come from products. At this granular level, you can learn about an individual product’s performance. The Product report includes three sections: product details, top level statistics, and a graph of revenue over time.

| Metric | Description | Calculation |
|---|---|---|
| Revenue | Revenue from units of the product sold | (sum (line item sale price - order level discounts) qty)) - (sum (line item price for returned + refunded products from orders in the time period) qty)) |
| Average Price | The average selling price per unit | (sum line item prices of product from all completed orders) / total quantity of product included in orders |
| QTY Sold | The quantity of the product sold | sum (qty of products in completed order) |
| Orders | The total number of orders that include the product | sum completed orders where this product is included as a line item |
| Visits | The number of page views the product received | sum (pageviews of this product page) |
| Abandon Rate | The percentage of abandoned carts that include the product | (total carts with product - total orders with product)/total carts with product |
Product detail graph
The revenue graph charts total revenue over the selected period of time and compares it to revenue from the previous period, for example, today versus yesterday. This allows you to see how the product performs over time. The graph in purple shows the revenue for your current date range, and the graph in orange represents the revenue from another date range selected for comparison.
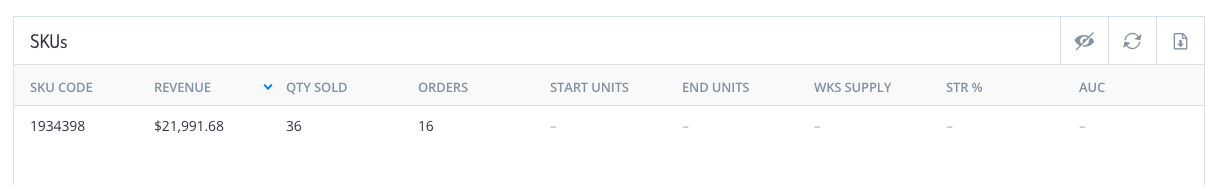
Product detail SKU statistics
Click the SKUs tab to view detailed information about each variant product of a base product sent to Commerce Insights.

| Metric | Description | Calculation |
|---|---|---|
| Revenue | Revenue from units of the SKU, including product-level discounts | (sum (line item sale price - order level discounts) qty)) - (sum (line item price for returned + refunded units from orders in the time period) qty)) |
| Average Price | Average price of the purchased units, including all discounts | (sum line item prices of units from all completed orders) / total quantity of units included in orders |
| QTY Sold | The number of units of the SKU sold | sum (qty of units in completed order) |
| Orders | The total number of orders that include the SKU unit | sum completed orders where this unit is included as a line item |
| Visits | The number of visits to the base product page | sum (pageviews of the base product page) |
| Abandon Rate | The percentage of abandoned carts that include the SKU | (total carts with this unit - total orders with this unit)/total carts with this unit |
Product detail SKU table
The SKUs table helps you quickly understand your product sales down to the variant level by providing important data about the best- and worst-selling variants. Click a column name to change how the list sorts.
Orders
The Orders report provides a snapshot of all orders placed on your site. It can help you gain a better understanding of how your orders break down into products, discounts, and the overall average order value (AOV). Monitoring these key statistics regularly and tracking any sudden drops or increases over time helps you understand how total orders impact sales growth.
| Metric | Description | Calculation |
|---|---|---|
| Total Orders | Total number of completed orders in a given time period | sum (completed orders) |
| Units Sold | Total number of units of products sold | sum (unique products across all completed orders) |
| Revenue | Sale price minus order discounts, item returns, and item refunds. The order must be placed and processed to be considered in this calculation. | (sum (line item sale price - order level discounts) qty)) - (sum (line item price for returned + refunded products from orders in the time period) qty)) |
| Percent of Orders Discounted | Percentage of all orders discounted at the order level | sum (completed orders discounted at order level) / sum (completed orders)) |
| AOV | Average Order Value, meaning the average amount of revenue from each completed order, not including returned and refunded orders | revenue / (completed orders - returned and refunded orders) |
Orders over time graph
The Orders graph charts completed orders over the selected period of time. The graph in purple shows the completed orders for your current date range, and the graph in orange represents the completed orders from another date range you select for comparison. You can hover over a data point to view exact values.
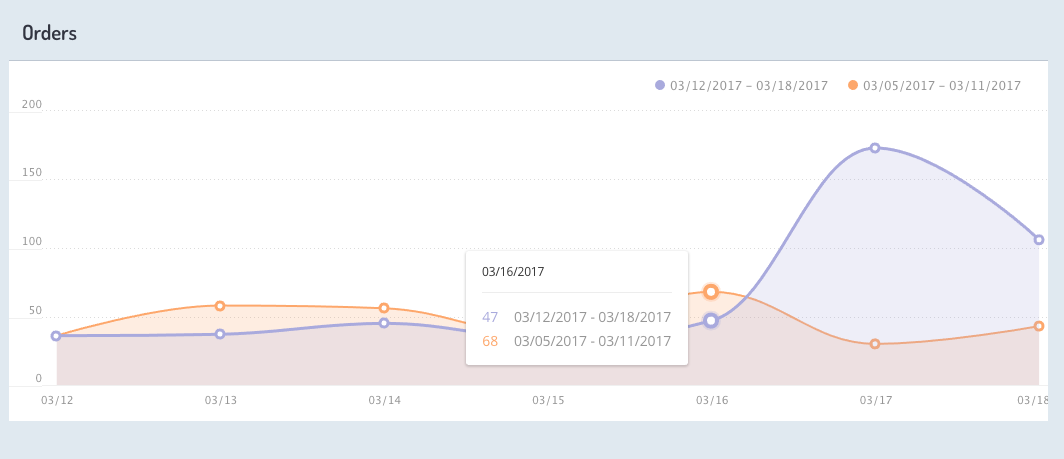
If the graph shows the current day, the orders are hourly and each calculation is for the sum total of completed orders from one hour. If the graph shows more than one day in the observation period, the orders are daily and each calculation is for the sum total of completed orders from one day.
Orders table
The Orders table lists all orders from your store. You can sort the table by clicking the arrows next to any column heading. Click the order number to view the order details report, where you can find more granular information about that specific order.
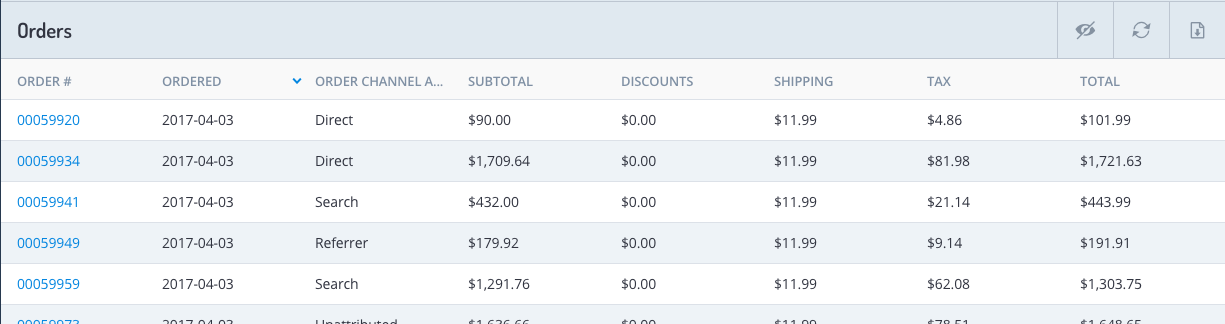
- Order # - The unique order ID
- Ordered - The date of order creation
- Order Channel Attribution - The channel through which the order originated
- Subtotal - The order subtotal excluding tax
- Discounts - The order discount dollar value
- Shipping - The amount charged for shipping, excluding tax
- Tax - The total tax for the order
- Total - The order total, including shipping and tax
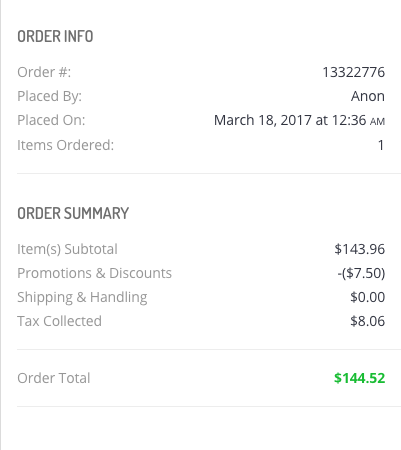
Order details report
This report shows you the product summary for a specific order, as well as who the customer is, how many items were ordered, and the discounted dollar value applied at the order level. You can use this chart to dig deeper into how individual items are selling and to monitor daily orders. All guest orders go into an anonymous placeholder customer.
Customers
The Customers report helps you better understand and analyze customer behavior. This report shows you where your customers originate from, the percentage of new versus returning customers, their total spend, and when they last placed an order. You can also access individual customer profiles that include the customer's order history as well as a list of products previously purchased.
This information can help you build effective customer loyalty programs and create tailored marketing campaigns based on customer history so you can tap your existing customers rather than constantly trying to acquire new shoppers.

Details included in the report are:
- Customers - Unique customers in the selected time period
- New Customers — Unique customers that purchase for the first time in the selected time period
- Percent of New — Percentage of customers that purchased for the first time
- Percent of Returning — Percentage of repeat customers
Customers table
The Customers table lists all customers from your store. You can sort the table by clicking the arrows next to any column heading. Click a customer's email address or name to view the customer details report, where you can find more granular information about that specific customer. Clicking the order number takes you to the order details report. An anonymous placeholder customer groups all guest orders.
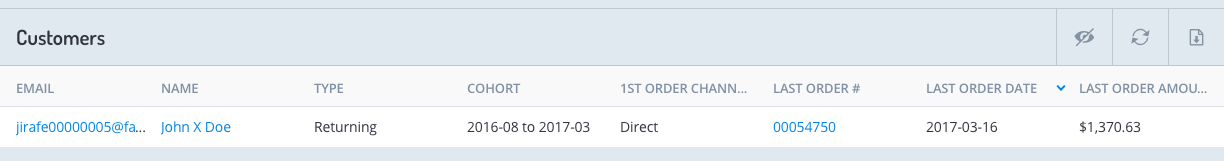
- Email — The email address of the customer
- Name — The name of the customer
- Type — Identifies either a new or returning customer
- Cohort — A group of clients based on their timeline of interactions with the store. The cohort is calculated using the date range between the client's first and most recent order.
- 1st Order Channel Attribution — The channel through which the customer found the store and made the first purchase
- Last Order Number — The order number of the client's most recent order within the given range
- Last Order Amount — The amount of the client's most recent order within the given range
- Total Spent — The lifetime spend of the customer
Customer details
The Customer Detail report provides data about the total amount the customer spent at your store, the customer's total number of orders, last purchase date, average order value (AOV), and the price range of the products in the customer's orders. There are statistics for the percentage of discounted orders or products that particular customer ordered. The customer’s full order history is available at the bottom of the report.
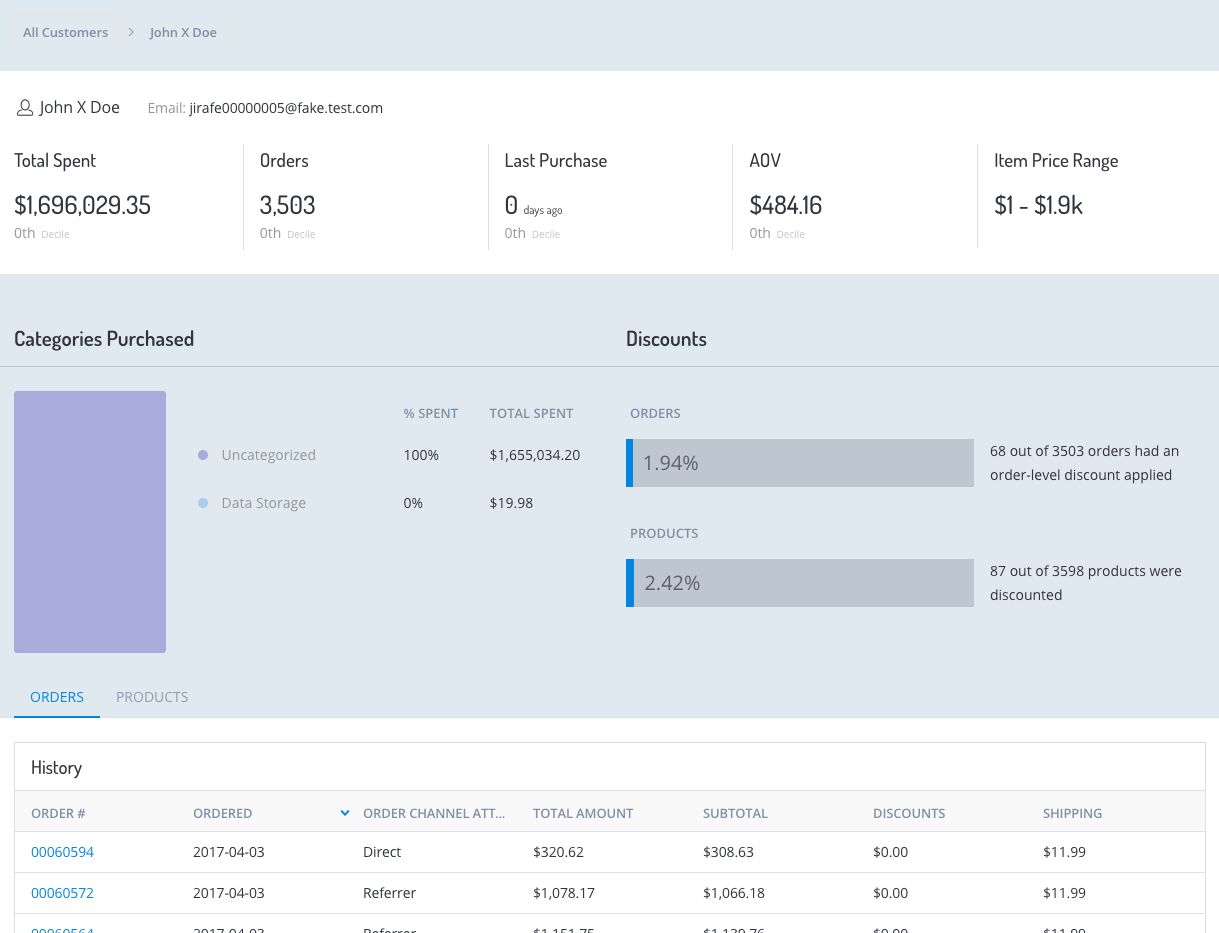
- Total Spent — Lifetime spend by the customer
- Orders — Lifetime orders from the customer
- Last Purchased — Days since the last purchase
- AOV — Average order value for the customer
- Item Price Range — Range of price for items purchased by the customer, excluding tax and shipping
Insights Overview
With the Commerce Insights solution, online merchants can get answers about their customer, marketing, and merchandising data and take action on what they learn in seconds. Traditionally, e-commerce businesses were forced to use complex reporting systems, or wrestle with Excel sheets to view their data and take action on it. Enterprise-grade business intelligence tools also require time, expense, and staff to build. Commerce Insights features a visualization interface that allows you to see your data in the form of answers.
Commerce Insights gives merchants like you the ability to drill down into information such as which products should get top placement on your site, and which marketing channels bring customers that spend the most over the lifetime of their relationships with your brand. Use Commerce Insights’ new solution to analyze data in seconds by simply viewing pre-formatted, intuitive depictions of your data. In a few clicks, you can view information about repeat purchase rates, cohort performance, and product performance without having to sift through data, create reports, or use Excel or other cloud-based reporting solutions.
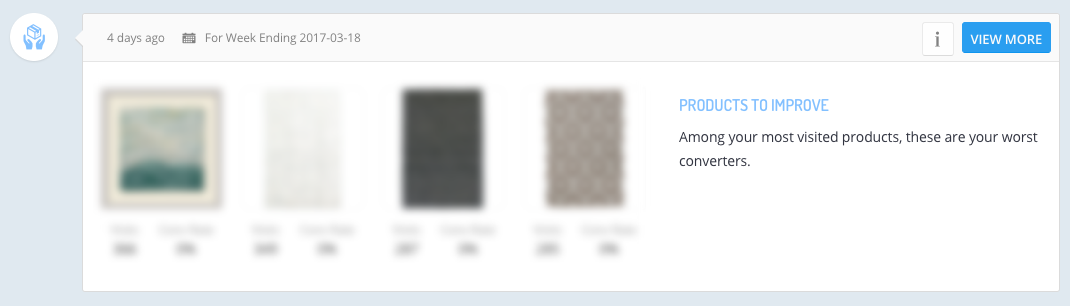
Anatomy of an insight card
Each insight type, described in more detail in the next section, follows a similar format in terms of the data and information displayed.
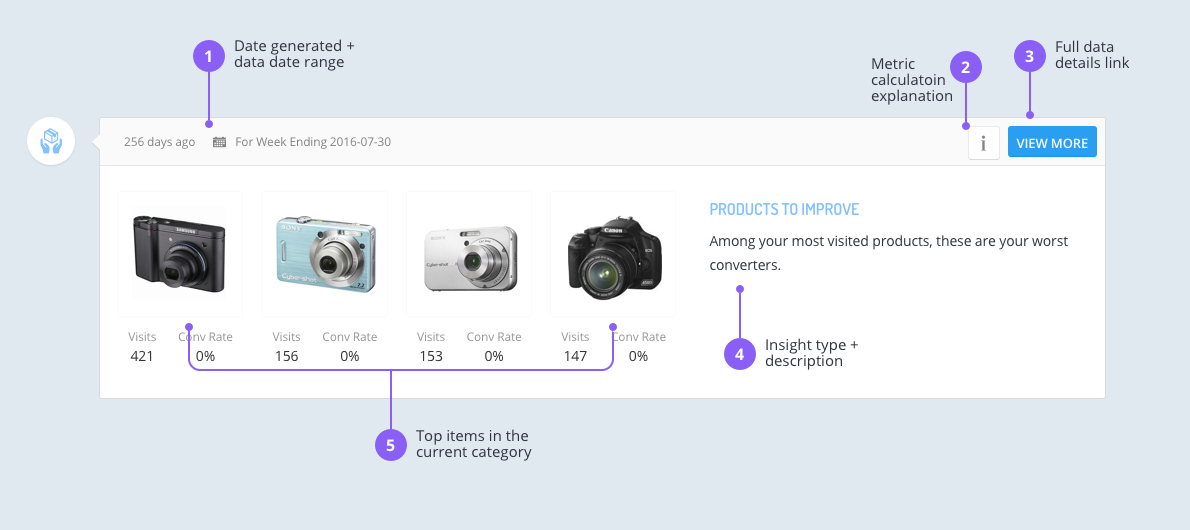
- Date generated/data date range - Shows the insight creation date and the time range of the raw data used to generate the Insights.
- View more - Click to view the details of the report, which along with the snapshot info, shows the entire list of products that qualify for the insight type.
- Info tooltip - Hover to display a brief explanation of the calculation used to determine items in the insight list.
- Type/description - Shows the insight title type, along with text explaining what the data means to you.
- Item snapshot - Each of these sections, whether images or a table, shows the top items from the insight calculation to encourage at-a-glance evaluation of your products.
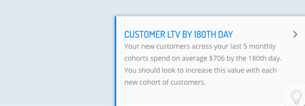
Intelligent alerts
Intelligent alerts display in the bottom right-hand corner of the application. These alerts make data more relevant to merchants by calling attention to key trends within the data, as well as provide suggestions about what steps merchants can take next to immediately improve business. When merchants receive a notification about a change in their businesses, they can drill down to the specific revenue opportunities that Commerce Insights found by analyzing their data in real time. Commerce Insights automatically creates all alerts, which are contextually-based, meaning every alert correlates with the specific area of the business the merchant is viewing.
Report Layout
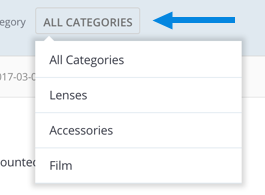
The drop-down menu on the Insights feed allows you to select the type of insight to sort by.
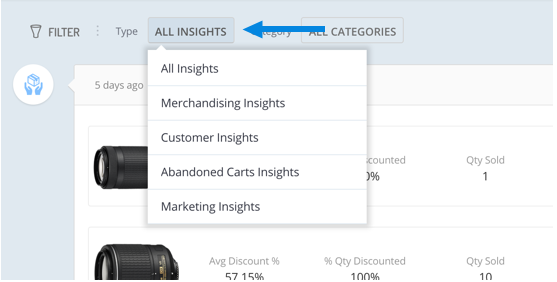
The category menu allows you to view your insights by product category, such as bestsellers or best customers, by the product category they fall into.
Summary view
The default Insights feed shows current and past insights at a summary level. Each insight summary contains the name of the insight, definition, and statistical information. Next to each insight, you can click through to a more detailed view.
Detail view
When you click an insights summary record, you can view a more detailed record of your data. You can also download your data to a CSV-format file to further sort your data or upload customer segments into your marketing automation system.
Insight types
There are three core display modes across all of the 30-plus insight types. Each of the display modes aims to communicate vital data in a way that makes sense for the calculated data of that insight.
Insight table - Use mostly for customer and category insights.
Insight products - Use exclusively for product insights, and always shows the image/name of the top products for the given insight type.
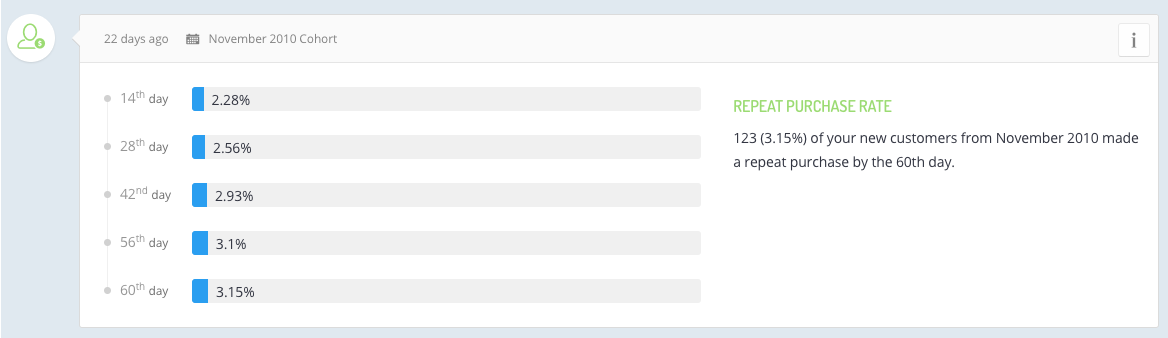
Insight timeline - Use for customer trends such as purchase rate over time.
Product Insight Types
The solutions's product insights include the categories described here, along with some suggested actions that you can take to improve results for each category.
Products to improve
Description: Your highest percentage of most-visited products, filtered to show those with above average conversion rates. The results sort by conversion rate from worst to best.
Suggested actions:
- A/B test your product images and Calls To Action (CTAs) to see if these steps affect conversion rates.
- Consider implementing interactive or video content to help customers get a better sense of what the product would look like in person.
- Use product feedback to help your customers make purchase decisions.
- Revise product descriptions to help better educate your customers about the product.
Rockstar products
Description: Your highest percentage of most-visited products, filtered to those with above average conversion rates. The results sort by conversion rate from best to worst.
Suggested actions:
- Use these products to lead customer acquisition campaigns.
- Use bestsellers to lead flash or seasonal sales to bring people to your site.
- Promote best-selling products across categories on your homepage or at the top of category pages.
- Create a featured section on your site containing bestsellers by category.
- Feature these items as suggested products on product detail pages or check-out pages.
Promising products
Description: Your bottom 80 percent, or least-visited products, filtered to show those with above average conversion rates, and then sorted by conversion rate from best to worst. Excludes any products with fewer than 20 visits.
Suggested actions:
- Boost sell-through rates by leading paid campaigns with these items.
- Place these products on your homepage to see if they drive additional revenue.
- Introduce these products more widely to customers through email marketing.
- Index these products to appear next to bestsellers in your site search results.
- Feature these items in category campaigns for Google or on social media to see if increased exposure turns these promising products into bestsellers.
- Lead email campaigns with promising products to increase conversions.
- Feature these items at the top of your category pages next to bestsellers to see if they get a boost in conversions.
- Feature these items as part of seasonal or special content landing pages.
Non-sellers
Description: Products with zero (0) orders, sorted by visits from most to least.
Suggested actions:
- Reduce the price of these items and place them into a sale category.
- Discount these items and use them in retargeting campaigns to encourage impulse buys.
- Bundle non-sellers with bestsellers or bundle non-sellers together and sell them at a discount.
- Sell these items on other online marketplaces at a reduced price.
- Implement a category-specific flash sale for non-sellers.
- Bundle with bestsellers in the same category at a discounted rate.
- Create a Call To Action (CTA) with a sense of urgency for the product.
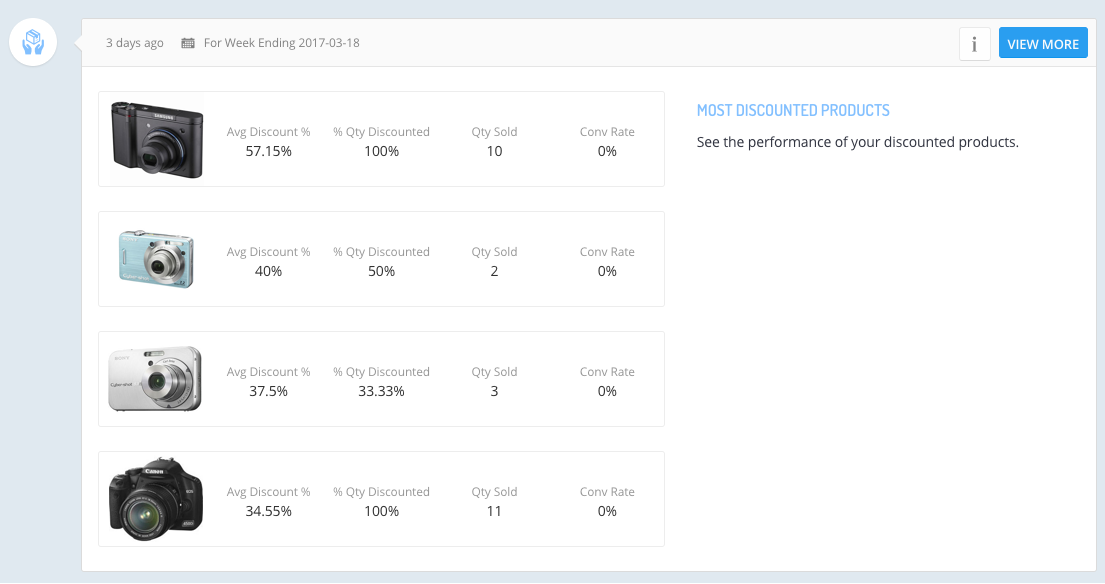
Most discounted products
Description: Products sorted by the average percent of discount applied, from highest to lowest. The average percent discount calculation is based on discounted items only.
Suggested actions:
- Lead seasonal sales with these items to make way for full-priced products.
- Include the items at checkout to increase your customer's average order value.
- Use them to create exclusive offers for social campaigns.
- Use these items to create incentives in marketing campaigns.
- Promote the items in search page results next to full-priced items in the same category.
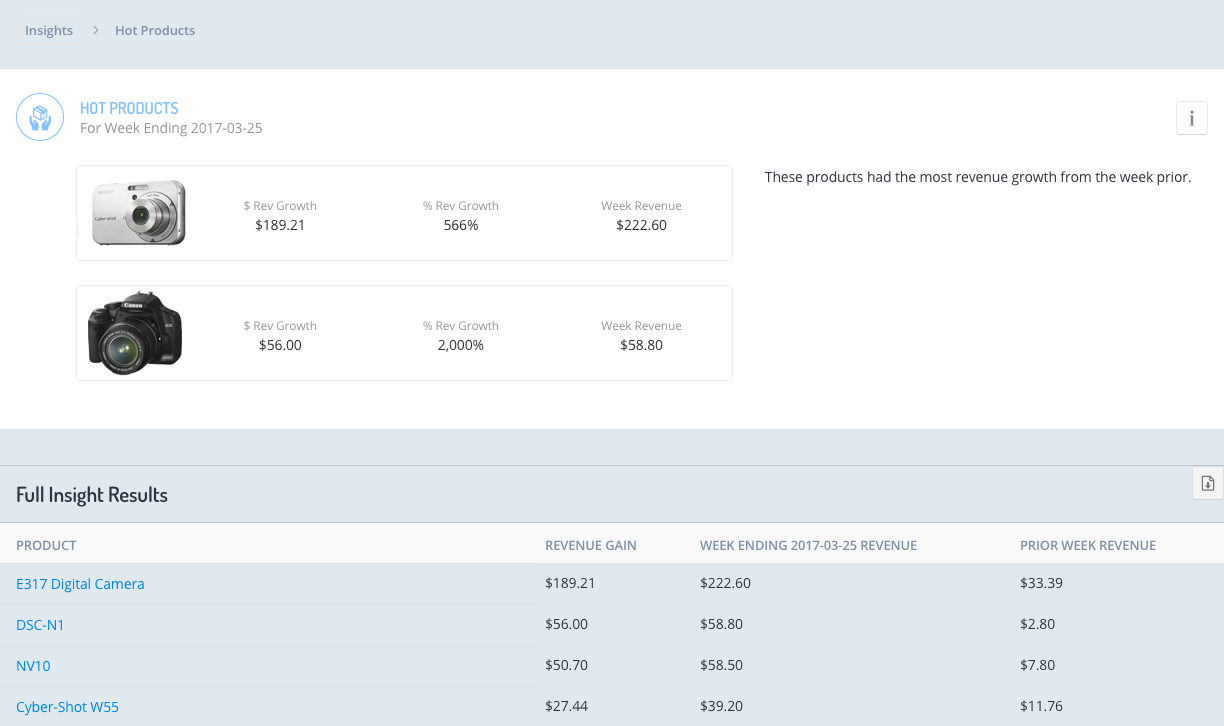
Hot products
Description: Products sorted by revenue growth in absolute terms, such as dollar growth. This category restricts to products that are two median absolute deviations above the median.
Suggested actions:
- Show hot products on the homepage of your store in a "most-loved" or "trending now" section.
- Lead email campaigns with these products to extend the demand curve.
- Feature these products in social media ads and campaigns.
- Create a curated landing page of trending products.
- Place hot products at the top of your category pages so customers see them first.
- Lead AdWords or paid social campaigns with bestsellers within a category.
Cold products
Description: Products sorted by revenue loss in absolute terms such as dollar loss. Restricted to products that are two median absolute deviations below the median.
Suggested actions:
- Offer temporary discounts to get sales moving again.
- Start a social campaign featuring those products to keep them top of mind.
- Consider suggesting them alongside complimentary hot products.
- If the item experiences a decline due to seasonality, hold seasonal or holiday sales to liquidate the item.
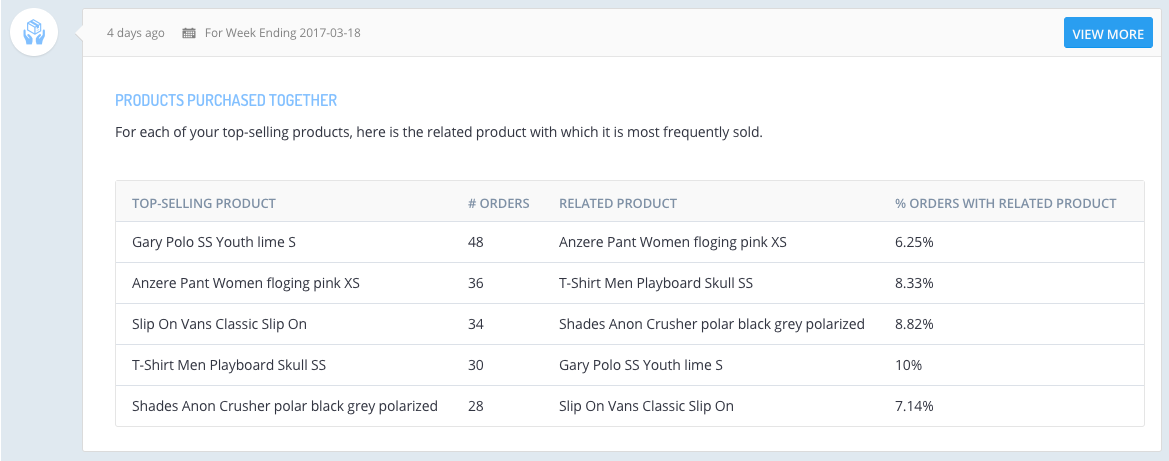
Products purchased together
Description: This category shows the related products that consumers most frequently purchase along with each of your top-selling products.
Suggested actions:
- Create product bundles to increase your customers' average order value (AOV).
- Send customers who purchased one of the products emails to introduce them to new items they might like.
- Show related products together in a site editorial or on product pages.
- Display related items during checkout.
Categories purchased together
Description: These categories are most frequently purchased together, within the same order.
Suggested actions:
- Cross-promote items from other categories on product detail pages.
- Lead marketing campaigns with products from complementary categories.
- Create targeted promotions that span categories, such as Buy One, Get One (BOGO) offers.
- Create editorial content or curated sections that feature the products.
Most abandoned products
Description: Your top ten percent of most-abandoned products. Look for outliers with a high abandonment rate.
Suggested actions:
- Retarget customers with an exclusive offer.
- Send customers an email that helps educate them about the product, including ratings and reviews.
- Send an email with recommendations for products in the same category.
- Improve your product listing with a better description, alternate images, or video content.
- Include social proof alongside products with a high abandonment rate. Social proof gives purchasers a higher sense of confidence about products.
Customer Insight Types
The service's customer insights include the categories described here, along with some suggested actions that you can take to improve results for each category.
Best customers
Description: Customers that meet these criteria:
- purchased in the last 30 days
- in the top two deciles (20%) of customers in orders
- in the top two deciles (20%) of customers in total spend
Suggested actions:
- Enroll these customers in a loyalty program.
- Send the customers emails featuring new products similar to those they already purchased.
- Offer early access to promotions and exclusive deals.
- Invite them to contribute user-generated content, featured in your social feeds or on your site so that you can engage other customers.
Best full-price customers
Description: Customers that meet these criteria:
- buy all items at full price
- purchased in last 30 days
- in the top two deciles (20%) of customers in orders
- in the top two deciles (20%) of customers in total spend
Suggested actions:
- Send customers exclusive previews of new products in categories that they purchase from frequently.
- Personalize your email communications with these customers and feature products from the categories they purchase from often.
- Cross-sell these customers items from other categories through email campaigns and site personalization.
Customers at risk
Description: Customers that meet these criteria:
- in the top two deciles (20%) of customers in total spend
- Last purchased between 30 and 365 days ago
Suggested actions:
- Send the customers category-level promotions such as a percentage off their next order or free shipping above a certain threshold.
- Enroll these customers in a loyalty program to encourage more frequent purchases.
- Introduce them to products similar or complementary to their last purchase by looking at the Products Purchased Together insight.
- Inform these customers about new products and give them a sense that they are getting a first look at what's new.
Low AOV customers
Description: Customers that meet these criteria:
- purchased in last 30 days
- in the top two deciles (20%) of customers in orders
- but in the worst two deciles (20%) of customers in average order value (AOV)
Suggested actions:
- Send these customers promotions within a category to help increase their AOV, such as a buy one, get one half off discount, using the Most Discounted Products insight.
- Offer bundled items using the Products Purchased Together insight to increase AOV in a category and offer the customers a slight discount together.
- Inform these customers first when items will be discounted in a particular category.
- Offer free shipping above a threshold that is around the average spend for this group.
Repeat purchase rate
Description: The repeat purchase rate is the percentage of customers who made a second order.
Suggested actions:
- Customers are more likely to repeat purchases if they feel like there are benefits associated with brand loyalty. Offer customers incentives to buy again.
- To increase the likelihood of a repeat purchase, greet customers with personalized recommendations on your site based on browsing and buying history.
- Customers are more likely to make a repeat purchase if you target them with offers that are relevant to them.
- Frequency of interaction with your customers can improve repeat purchase rates. Reach out to your customers on a daily basis to ensure that your brand is top of mind.
Best categories for repeat purchase
Description: The repeat purchase rate calculates from the percentage of customers who made a second order, and is then applied across categories.
Suggested actions:
- Target customers with products from this category to drive similar purchases through email or on your site.
- Follow up with a campaign to cross-sell items from complementary categories to drive your customer's next purchase.
- Use bestsellers from these categories to drive on-site product recommendations.
- Create curated content sections on your site with items from these categories to introduce customers to new products.
Best products for repeat purchase
Description: Repeat purchase rate calculates from the percentage of customers who made a second order, and is then applied across products.
Suggested actions:
- Target your most engaged customer segments with marketing campaigns led by these products to encourage them to buy again.
- Combine this information with your repeat purchase rate insights and time your email campaigns accordingly.
- Use these products to lead campaigns directed at your at-risk customers, encouraging them to buy again.
- Target returning customers with these products through site personalization.
Viewed but did not purchase
Description: This category shows customers who viewed the same product page more than once. Opportunities are sorted by the number of page views, unique visits, and unique days visited. The higher these values, the more interest shown.
Suggested actions:
- Retarget customers with ads based on items they viewed but did not purchase.
- Share product reviews to help influence your customer's buying decision.
- Create a sense of urgency by reminding them the product is available in limited quantities.
- Give them incentives or offer a promotion to encourage the purchase.
Customer LTV - 30/90/180/360th Day
Description: Averaged Customer Lifetime Value (CLTV) by the specified day for new customers, from the most recent month period where all customers have had at least the designated days of lifetime.
Suggested actions:
- Increase your customer lifetime value by featuring your customers in social posts.
- Send your customers exclusive offers to help increase your CLTV and ensure repeat purchases.
- Let customers give you product feedback and publicize that feedback.
- Send customers promotions featuring personalized content to stand out from your competition.
Customer LTV by channel - 1st/90th/180th Day
Description: Averaged Customer Lifetime Value (CLTV) by the specified day for new customers, from the most recent month period where all customers have had at least the designated days of lifetime, applied to the channel used to make the purchase.
Suggested actions:
- Determine which channels bring you the highest value customers and optimize your marketing spend to find more like them.
- Look beyond cost-per-acquisition and evaluate AdWords based on customer spend over the long term.
- Prioritize your social marketing channels by how valuable customers are from each channel over time.
- Determine which advertising networks and affiliate partners attract high value customers and adjust your promotions accordingly.
- Use this data to optimize your current marketing efforts to find higher value customers.
- Focus your social efforts on those channels that are driving the highest customer growth.
Customer LTV by product - 1st/90th/180th Day
Description: Averaged Customer Lifetime Value (CLTV) by the specified day for new customers, from the most recent month period where all customers have had at least the designated days of lifetime, applied directly to products.
Suggested actions:
- Lead customer acquisition campaigns through channels that drive the highest CLTV with these products.
- Introduce variations of the product into your assortment.
- Cross-promote the product to customers that have a low CLTV with ratings and social proof to encourage them to spend more.
If you find any information that is unclear or incorrect, please let us know so that we can improve the Dev Portal content.
Use our private help channel. Receive updates over email and contact our specialists directly.
If you need more information about this topic, visit hybris Experts to post your own question and interact with our community and experts.