
SAP Hybris Data Hub Monitoring
Data Hub Monitoring Overview
Data Hub Monitoring provides a detailed view into the lifecycle of a batch, document, or item on its journey through Data Hub. All important events that affect the item are published to Data Hub Monitoring, where they are processed and aggregated. Items are grouped into batches and documents to provide a more comprehensive view of related items (for example, products and their variants) and their statuses.
The data from events created at key junctures of activity passes to a component called the Event Publisher. The Event Publisher packages the event data and passes it to the Event Receiver in the Data Hub Monitoring application.
The Event Receiver validates the event data and distributes it to the other actors in the Data Hub Monitoring application. After the event data processes, you can see the lifecycle of an item more clearly. With a standard view, you see the process data, or you might drill down to further detail. Another level of user scope supports a deeper and more detailed review, but you cannot usually view this access level due to privacy concerns.

Many types of Data Hub activity trigger monitoring events, such as loading, grouping, composing, and publishing. These events end up with a Data Hub component named the Event Publisher. The Event Publisher serializes, batches, and pushes events to the Event Receiver. The Event Receiver unmarshals the data, validates each event, and stores all valid events. The Event Receiver sends invalid events back to Data Hub for handling. Statuses for all batches, documents, and items are calculated to reflect the latest activity in the Data Hub Monitoring UI.
The Data Hub Monitoring application provides a view into many types of activity inside Data Hub. It is also read-only, so error correction cannot take place using this application. You must correct any errors at the source system, so the system processes future Data Hub data imports without error. In the following, you can see a screenshot of Data Hub Monitoring with a query for some data.
Set Up Data Hub Monitoring on YaaS
You decide to enable monitoring for your Data Hub installation. There are several things you need to do in YaaS before you can proceed.
Set up a project
- Register for a YaaS user account. Go to YaaS.io.
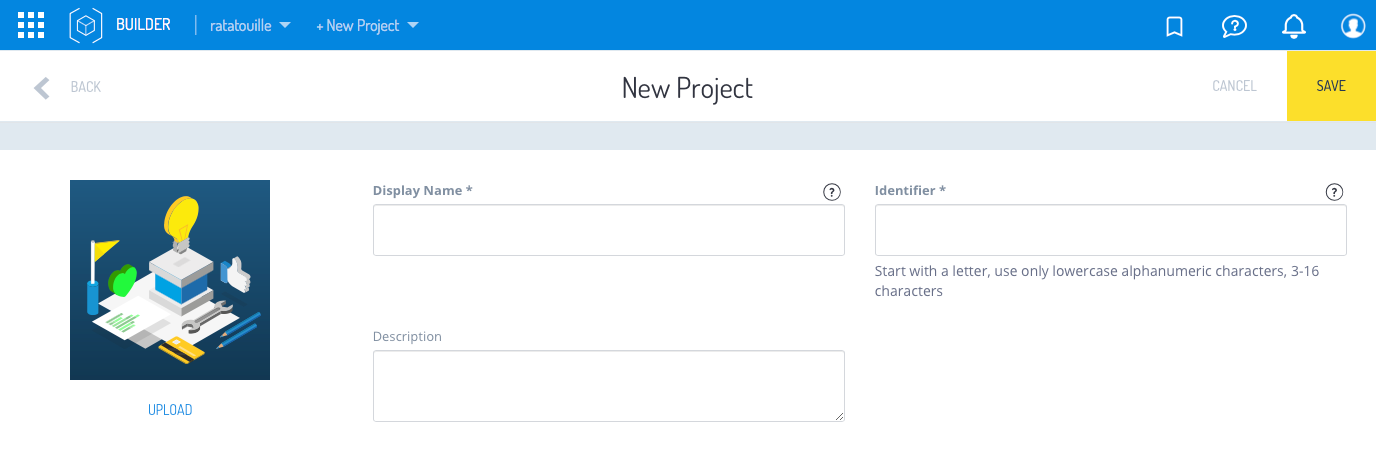
- Create a personal project to house Data Hub Monitoring. From the Builder menu, click +PROJECT.
- Create your YaaS project.
- In Builder, navigate to your project screen.
- Navigate to Administration > Subscriptions and click Data Hub Monitoring to subscribe to the Data Hub Monitoring package.


Set up a client
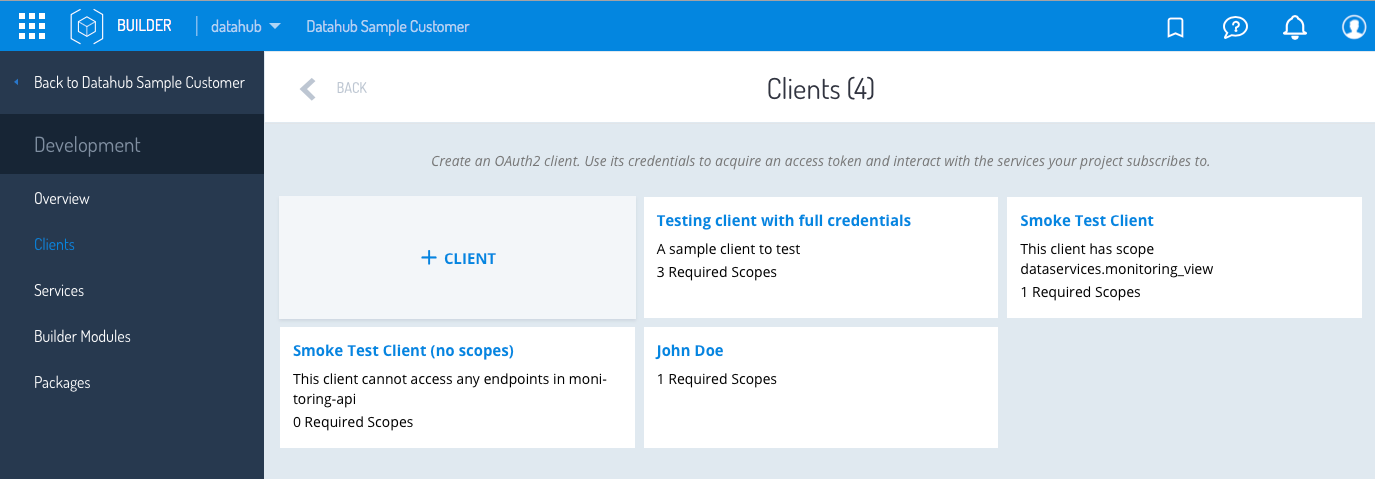
- In your project, click Development > Clients.
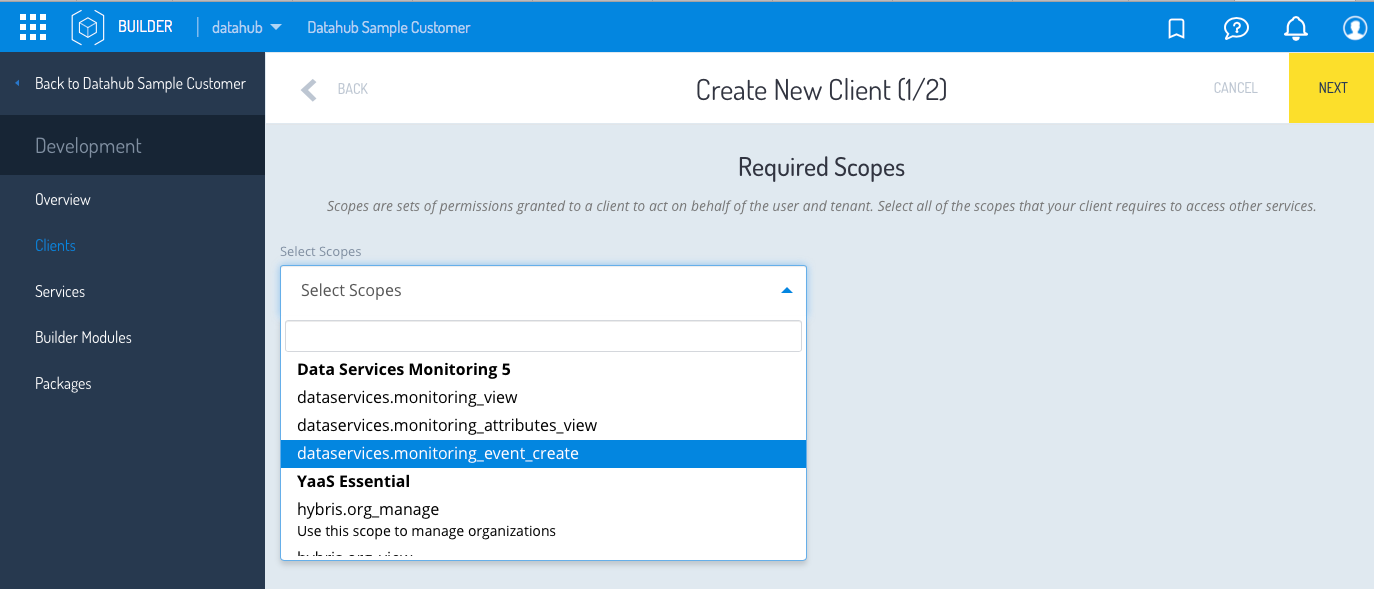
- Click +CLIENT to create a client account.
- From the Select Scopes list, select
dataservices.monitoring_event_create. Click Next. - Fill in the Identifier field with the client ID and enter a Display Name. Leave the Redirect URIs and Logout Redirect URIs fields blank. Click Save. The client is a user ID, and you have assigned a range of capability by assigning a scope.
- Navigate to the details of the newly-created client by clicking the client’s name.
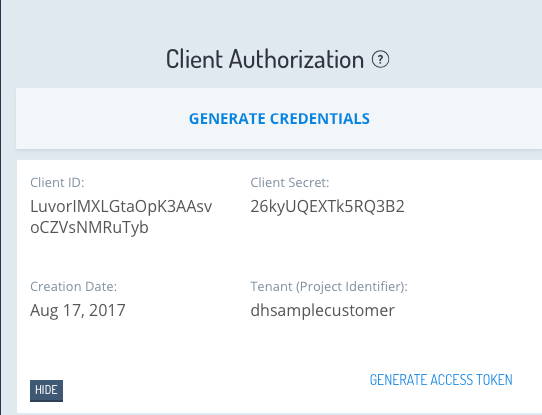
- The screen shows the client detail.
- Scroll down to the Client Authorization section and click SHOW to show the credentials.
- Note the
Client IDandClient Secret. You need these values to configure Data Hub’s local.properties file. See Client ID and Client Secret for more information.


Roles and users
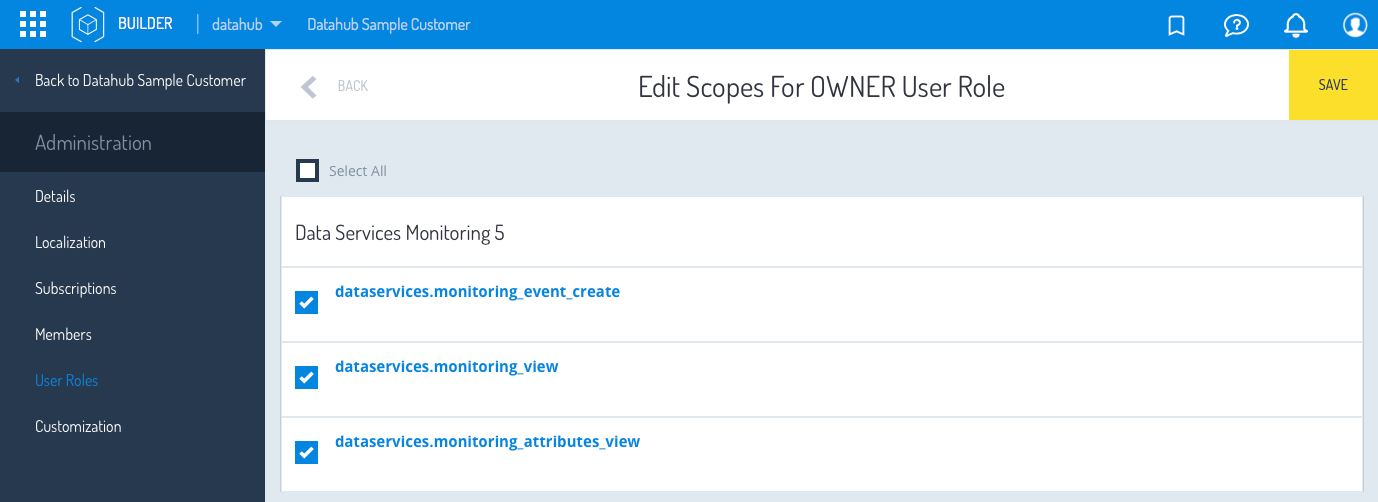
- Navigate back to your project’s Administration > User Roles page.
- Click the Owner role to edit its details.
- Click MANAGE SCOPES to add scopes. Choose all of the dataservices.* scopes and click Save. There are two possible roles. One is for the OWNER of the data and allows you to view the actual Data Hub data and processes. For the OWNER, be sure to select the dataservices.monitoring_attributes_view. The other role only allows for the viewing of Data Hub processes.
- Navigate back to the main project overview and click Data Hub Monitoring.

Addressing User Scopes
Data Hub Monitoring requires the scope dataservices.monitoring_view to access all REST endpoints. Configure scopes through the YaaS Builder Scopes. You can assign the scopes to user roles. See the Roles documentation for more information.
If your role has the scope dataservices.monitoring_view, you get view privileges into Data Hub Monitoring. With the view privileges, you see Data Hub processes flowing through Data Hub Monitoring such as batches, documents, items, and their statuses.
Another scope, dataservices.monitoring_attributes_view, enables you to see an attribute's values for items, meaning actual Data Hub data. Only assign this scope to user roles that require access to view item attributes.
Connect Data Hub
To connect Data Hub to Data Hub Monitoring, perform the following procedures.
Activate monitoring events
Data Hub disables all monitoring events by default. You must enable them in your local.properties file. The properties are:
datahub.event.canonicalitem.enabled=truedatahub.event.itempublication.enabled=truedatahub.event.data-attributes.enabled=truedatahub.event.batches.received.enabled=truedatahub.event.push.enabled=truedatahub.event.receiver.enabled=truedatahub.event.receiver.oauth.url=oauth2datahub.event.receiver.url=Event Receiverdatahub.event.receiver.oauth.scope=dataservices.monitoring_event_create
For more information about the Data Hub Events, see Event Receiver
Configure the Data Hub Event Publisher
Review the Monitoring Events. In particular, note the datahub.event.receiver.url property, which contains the network location of the Data Hub Monitoring Event Receiver.
- When you set up your YaaS project and users, you were asked to note your
clientIdandclientSecret. Add these to your Data Hub local.properties file.- Add
datahub.event.receiver.oauth.clientId={value} - Add
datahub.event.receiver.oauth.clientSecret={value}
- Add
- Using the aforementioned properties, create the connection between your Data Hub installation and the Data Hub Monitoring application in your YaaS Project.
DFD for Data Hub Monitoring
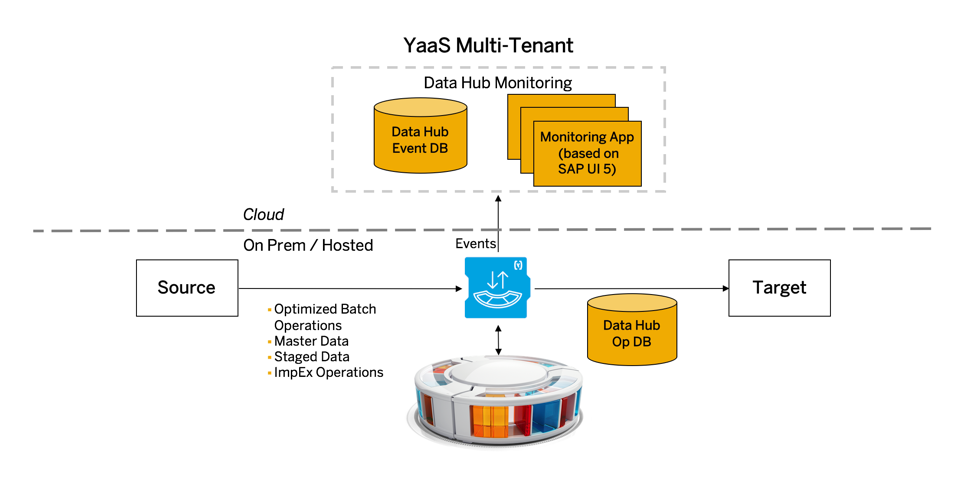
The following graphic illustrates the flow of data from the source system to the Data Hub Monitoring application. In this case, the source is Data Hub, but the Data Hub Monitoring application supports other sources.
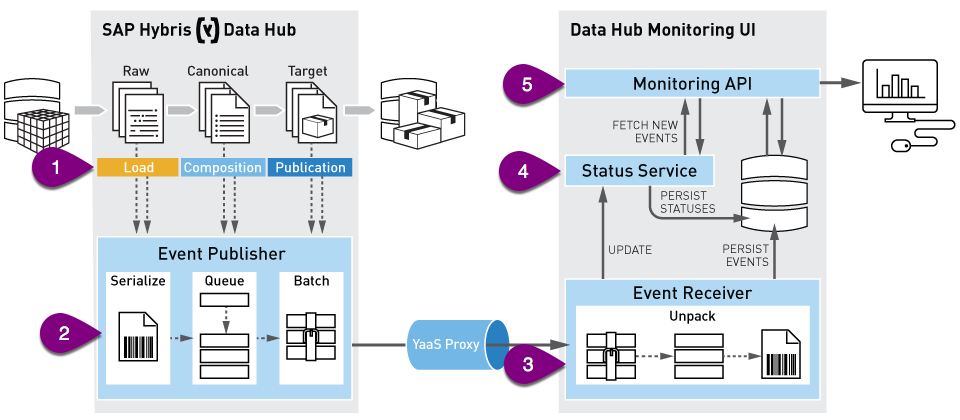
 : The following is a brief description of Data Hub's three phases of data processing, but it ties back to the statuses you see in the Data Hub Monitoring application. For more information about these topics, see Basic Aspects of Load, Compose, and Publish.
- Load - Raw items load from a source system into Data Hub. You can, if you choose, populate three custom fields:
- dh_batch
- dh_source
- dh_type
RECEIVED. - Compose - Data Hub processes raw items. The data passes through default and custom algorithms that organize and manipulate it. The system creates documents here. A document is a group of logically related items, tracked together as a single entity. For example, a product with its variants, a business unit with its addresses, and so on. Typical document statuses are:
PENDING_PUBLICATIONafter the system successfully composes a canonical itemSUPERCEDEDwhen the system replaces a value with an updated value
- Publish - The system publishes composed data to a target system. The most common status is PUBLISHED, which the system uses for batches, documents, and items. Other statuses are:
COMPLETE_FAILURE, when, for example, all items fail to publishSUCCESS, when all items publish successfully, or when all items eligible for publication publish successfully, but ineligible items remain inPENDING_PUBLICATIONstatusPARTIAL_ERROR, when at least one document or item is incorrectNOT_PUBLISHED, when items fail to publish and the allowable number of retries is exceeded
Each Data Hub process generates event data that passes to the Event Publisher.
 : The Event Publisher is a component of Data Hub. It serializes and queues all enabled monitoring events, then unqueues them in batches and publishes them to a configurable endpoint. For more information, see the Data Hub documentation at Event Publisher
 : The Event Receiver validates the incoming event data. It also ensures that no required fields are missing before persisting the events.
 : The Status service calculates the status of batches and documents. Data Hub sends item statuses. The statuses describe where the batch, document, or item is in the Data Hub processing lifecycle.
 : The Data Hub Monitoring user interface uses the Monitoring API, which is not meant for public consumption.
About Event Receiver
Event validation
The Event Receiver determines whether incoming events are valid. It also ensures that no required fields are missing before persisting the events.
Currently, the Event Receiver handles:
- BatchesReceivedEvent
- CanonicalItemEvent
- ArchivedCanonicalItemEvent
- CanonicalItemPublicationStatusEvent
- NoMorePublicationAttemptsEvent
When the Event Receiver service receives some events, the service triggers the status calculation service. It calculates the statuses for batches and documents based on the incoming events that are persisted in the database. For a detailed treatment of statuses in the Data Hub Monitoring application, see Statuses.
The events that trigger the status calculation are:
- BatchesReceivedEvent
- CanonicalItemEvent
- ArchivedCanonicalItemEvent
- CanonicalItemPublicationStatusEvent
- NoMorePublicationAttemptsEvent
When the service receives a BatchesReceivedEvent, the status defaults to Received. The default to the received status happens when a Data Loading action occurs, but no composition has taken place. The preceding description represents the default state of the batch before the composition of the batches' items initiates. If no events exist, no status calculates or persists.
If you receive any of the item events, and they trigger a calculation before the BatchesReceivedEvent persists, there is no calculation and no persistence. The process triggers again for those items upon receipt of the BatchesReceivedEvent.
Invalid event
If a client sends an event to the Event Receiver, and the event does not appear in the preceding section, the Event Receiver returns an HTTP 400 response code with a JSON payload indicating the sent event is invalid.
Required fields missing
If the event type is valid, the Event Receiver validates whether the required fields appear for each event.
Required event fields
The required fields for each event appear in the following.
BatchesReceivedEvent
- traceId
- created date
- Each item in the batch's batchPrimaryId list must provide batchPrimaryId
CanonicalItemEvent, ArchivedCanonicalItemEvent, CanonicalItemPublicationStatusEvent, and NoMorePublicationAttemptsEvent
- uuid
- traceId
- The batch's batchPrimaryId
The Event Receiver returns an HTTP 400 response code with a JSON payload indicating which events are missing required fields. The JSON payload contains all the validation errors. An example response follows:
{
"status":"400",
"type":"validation_violation",
"message":"One or more events had violation errors. Please see details.",
"errorEvents":[
{
"event":"InvalidEventName",
"type":"invalid_event",
"message":"InvalidEventName is not a valid event type",
"eventDetails":"eventName: \"InvalidEventName\"\n"
},
{
"event":"BatchesReceivedEvent",
"type":"required_fields_missing",
"message":"The following required fields are missing: [batchPrimaryId].",
"eventDetails":"eventName: \"BatchesReceivedEvent\"\nbatchesReceivedEvent {\n traceId: \"traceId\"\n batches {\n type: \"type\"\n }\n createdDate: 1000\n}\n"}
]
}
Statuses
Items, documents, and batches are all units of data within Data Hub. Each of these units receives a status depending upon its current state. The status helps you determine where the data unit is, and its future potential.
Status service
The Status service calculates the statuses of batches, documents, and items. The statuses explain where the batch, document, or item is in the Data Hub processing lifecycle.
- Item - a single record of data that Data Hub processes
- Document - a group of items logically related to each other and tracked together as a single entity. For example, a product with its variants or a business unit with its addresses.
- Batch - a group of documents or items to be tracked together. By default, batch is the data-loading action ID in Data Hub. However, it’s possible to load multiple batches in a single data-loading action.
Item statuses
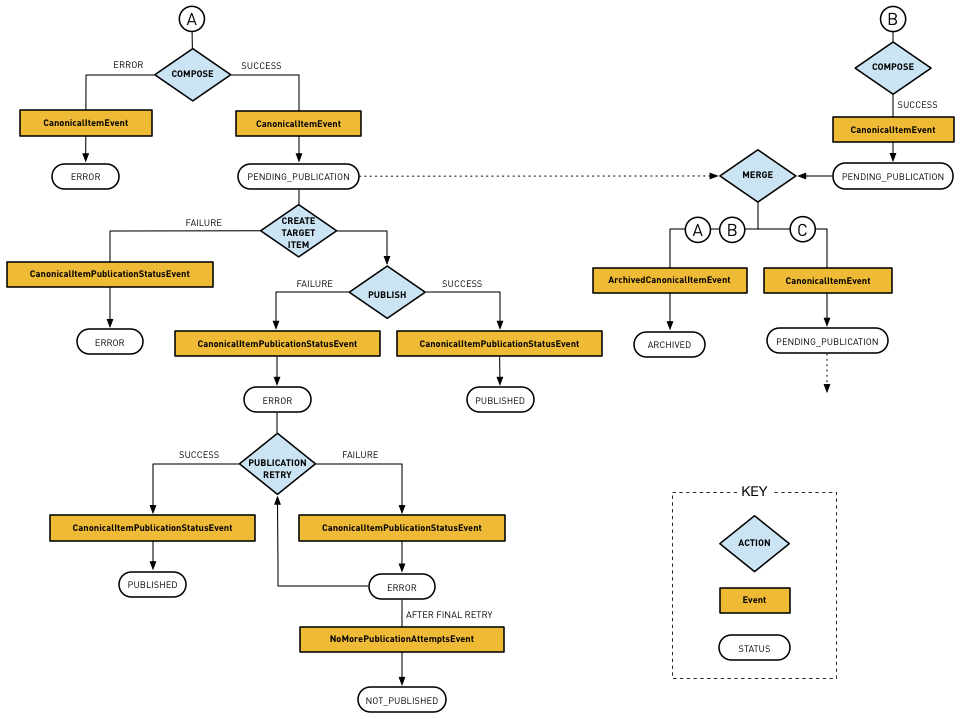
An item has one of five statuses: PENDING_PUBLICATION, ERROR, NOT_PUBLISHED, PUBLISHED, or ARCHIVED. These statuses depend on the lifecycle events that Data Hub sends for the item:
PENDING_PUBLICATIONmeans the item composes successfully, but it remains unpublished.PUBLISHEDmeans the item successfully published to the target system.PUBLISHEDis a final state for the item.ERRORmeans that an error occurred while processing the item. The error is one of the following:- item composition failed
- target item creation failed
- the attempt at item publication failed to deliver the item to the target system
- the target system received the item but reported an
ERRORback to Data Hub
AnERRORstatus does not always mean a final failure. With retries enabled in Data Hub, the item might publish successfully in the next publication cycle. A successful publication then changes the item's status toPUBLISHED. In the case of composition failures or target item creation failures, the status is final. If the target system reports the status, the status changes to eitherPUBLISHEDorNOT_PUBLISHEDdepending on the result of the next publication attempt(s).
NOT_PUBLISHEDmeans that the item cannot be published to the target system.NOT_PUBLISHEDis always a final status.ARCHIVEDmeans a newer version of this item is available. The status is final. After you archive an item, it cannot be published.
Possible item state transitions
Besides tracking the publication status, the service marks the item as archived when it receives an ArchivedCanonicalItemEvent event. If an item gets published first and then archived, the item status is PUBLISHED and the archived flag on the item is set to true. The following table shows possible combinations of item status and its archived flag. The status and archived flag values depend on when the monitoring events are received:
| Status | Possible Archived Flag Values |
|---|---|
PENDING_PUBLICATION | false |
ERROR | false or true |
ARCHIVED | true |
PUBLISHED | false or true |
NOT_PUBLISHED | false or true |
There is another instance where ArchivedCanonicalItemEvent fires. An item has no older versions, and there are multiple raw items from different batches that compose it. For example, if you load these raw items, the system composes a canonical product:
| Trace ID | Batch ID | Item (integration) Key | Attributes | isoCode |
|---|---|---|---|---|
| t1 | b1 | Product-123 | {name="English Name"} | en |
| t1 | b1 | Product-123 | {name="German Name"} | de |
| t2 | b1 | Product-123 | {quantity=25} | |
| t3 | b2 | Product-123 | {quantity=24} |
The canonical product has traceId=t3, batchId=b2 of the last raw item, and the attributes name=["English Name", "German Name"] and quantity=24.
In the process of composition, one ArchivedCanonicalItemEvent fires for the canonical items with IDs. To ensure that the monitoring system only tracks the active canonical items, archive an existing canonical item when a newer version of the item appears.
| Trace ID | Batch ID |
|---|---|
| t1 | b1 |
| t2 | b2 |
Document statuses
A document is an aggregation of several items, so document statuses depend on the combination of the item statuses. Possible document statuses and their meanings are:
PENDING_PUBLICATION: There are no errors in item processing, and there is at least one item that has made no attempt to publish yet. In other words, either none of the document items are published or some of the items published successfully, but there are still items that have made no attempt to publish. If there is one item that is ineligible for publication to any target system, the document status remainsPENDING_PUBLICATION. This status does affect the batch statuses.PARTIAL_ERROR: The document contains at least one item with anERRORstatus. Other items might havePENDING_PUBLICATION,ARCHIVED, orPUBLISHEDstatuses.COMPLETE_FAILURE: All items in the document have anERRORstatus or aNOT_PUBLISHEDstatus.SUPERCEDED: All items in the document are in the archive, which means there is a newer version of the document or items to publish.SUCCESS: At least one item isPUBLISHED, and other items are eitherPUBLISHED,PENDING_PUBLICATION, orARCHIVED.
Batch statuses
A batch is an aggregation of several documents or items. If a batch contains only items and no documents, then the system determines its status exactly the same way it determines a document status. In the case where documents are presented, the system calculates their aggregated status as follows:
RECEIVED: This status indicates the successful loading of data.PENDING_PUBLICATION: As long as at least one document is published, the batch has aSUCCESSorSUPERCEDEDstatus. If the batch has one item that is ineligible for publication to any target system, the document status remainsPENDING_PUBLICATION.PARTIAL_ERROR:- All documents have the
PARTIAL_ERRORstatus.SUPERCEDEDdocuments might be present also, as long as at least one document has thePARTIAL_ERRORstatus. - At least one document has a status of
PENDING_PUBLICATIONorSUCCESS, and all other documents have thePARTIAL_ERRORorCOMPLETE_FAILUREstatus.SUPERCEDEDdocuments might or might not be present.
- All documents have the
COMPLETE_FAILURE: All documents have theCOMPLETE_FAILUREstatus with, optionally, someSUPERCEDEDdocuments present.SUPERCEDED: All documents have theSUPERCEDEDstatus only, which means these old documents are no longer used. Instead, new documents supercede them.SUCCESS: All documents have theSUCCESSstatus with, optionally, someSUPERCEDEDdocuments present.TOO_MANY_ITEMS_IN_BATCH: There is a limit of 100,000 items per batch. If the batch size exceeds the limit, assign this status.
Data in Data Hub Monitoring
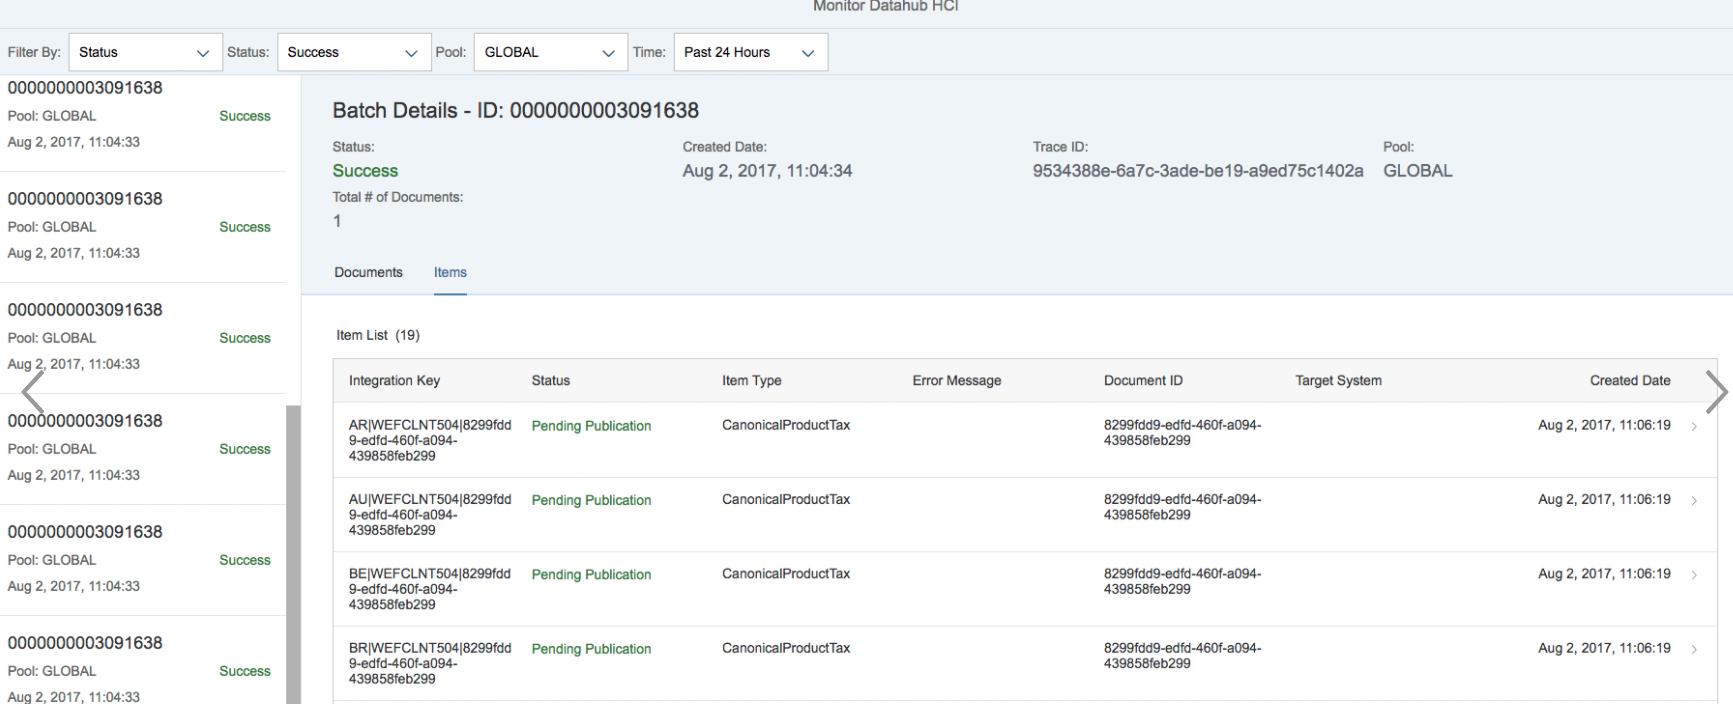
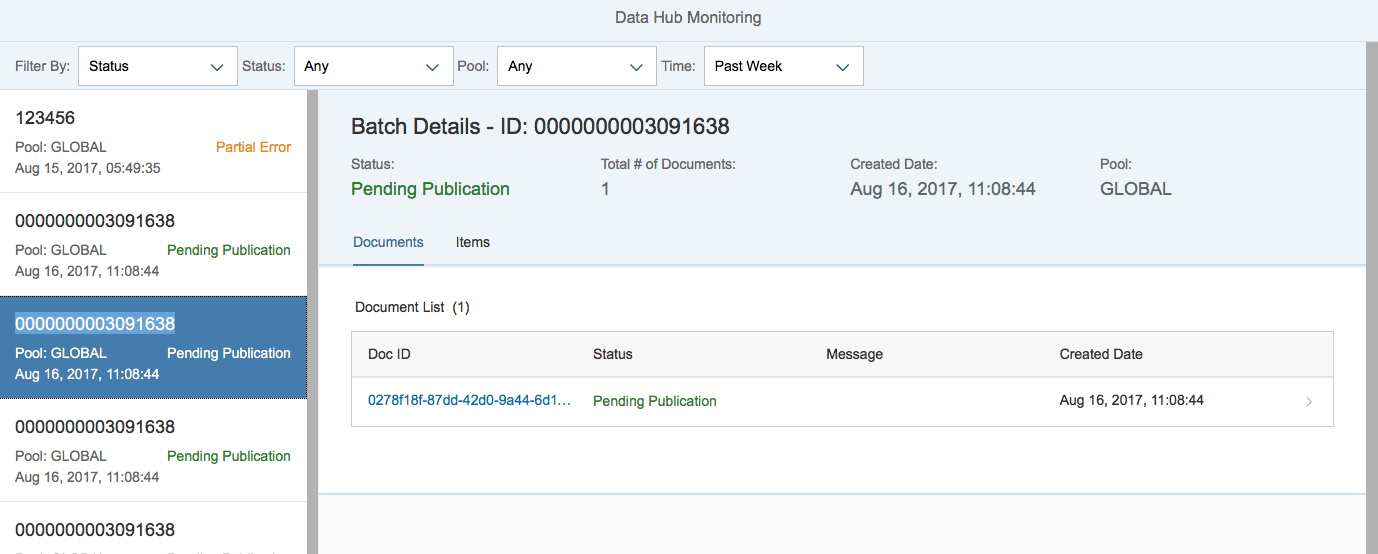
What does Data Hub data look like when it passes through the Data Hub Monitoring application? The following graphic illustrates its appearance.

You can see that the selection criteria is initially Status. Any status, any pool, in the last 24 hours is the default selection. However, you can choose the drop-down arrow next to the status field and pick from several other statuses. You can refine your search even further by looking at a specific data pool within a specific time frame.
By clicking on the item, you can view the details of that item on the next page.
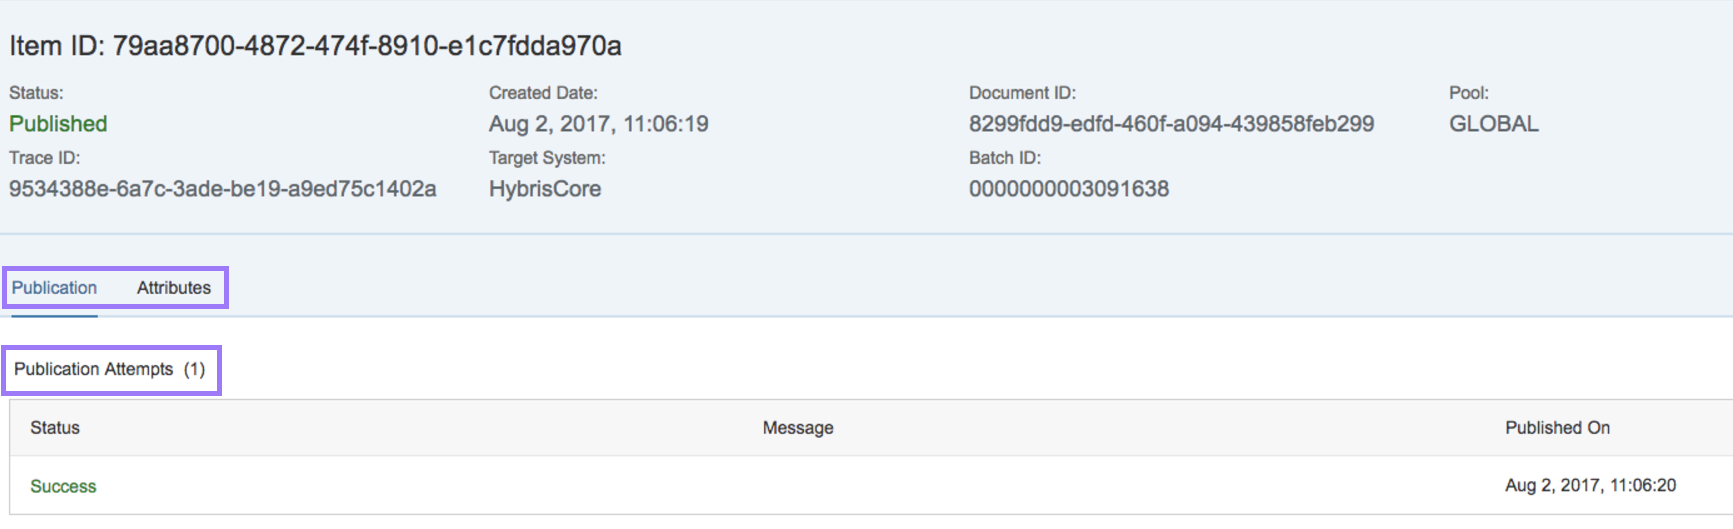
If you have the correct permissions level, you can see the Attributes tab to the right.
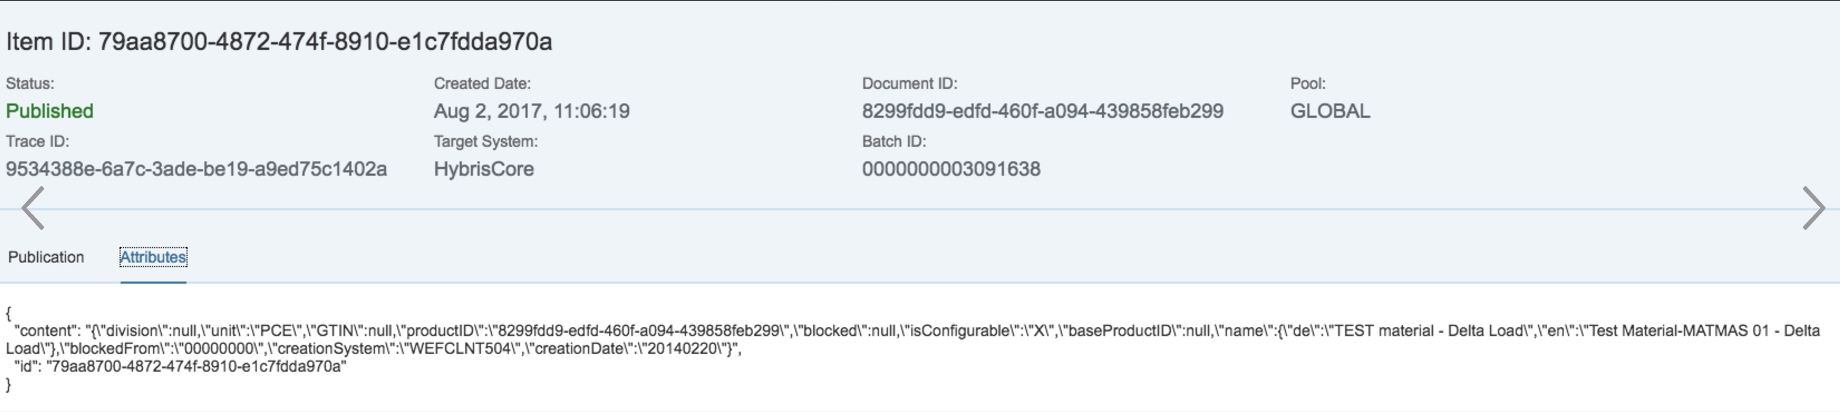
Attributes describe the item metadata and also show the actual Data Hub data.
You can also review the data by BatchID, which is equivalent to the IDoc number. Just enter the BatchID number in the Search field. Only batches have a search functionality, and the search only returns batches. The following graphic illustrates what you might see:
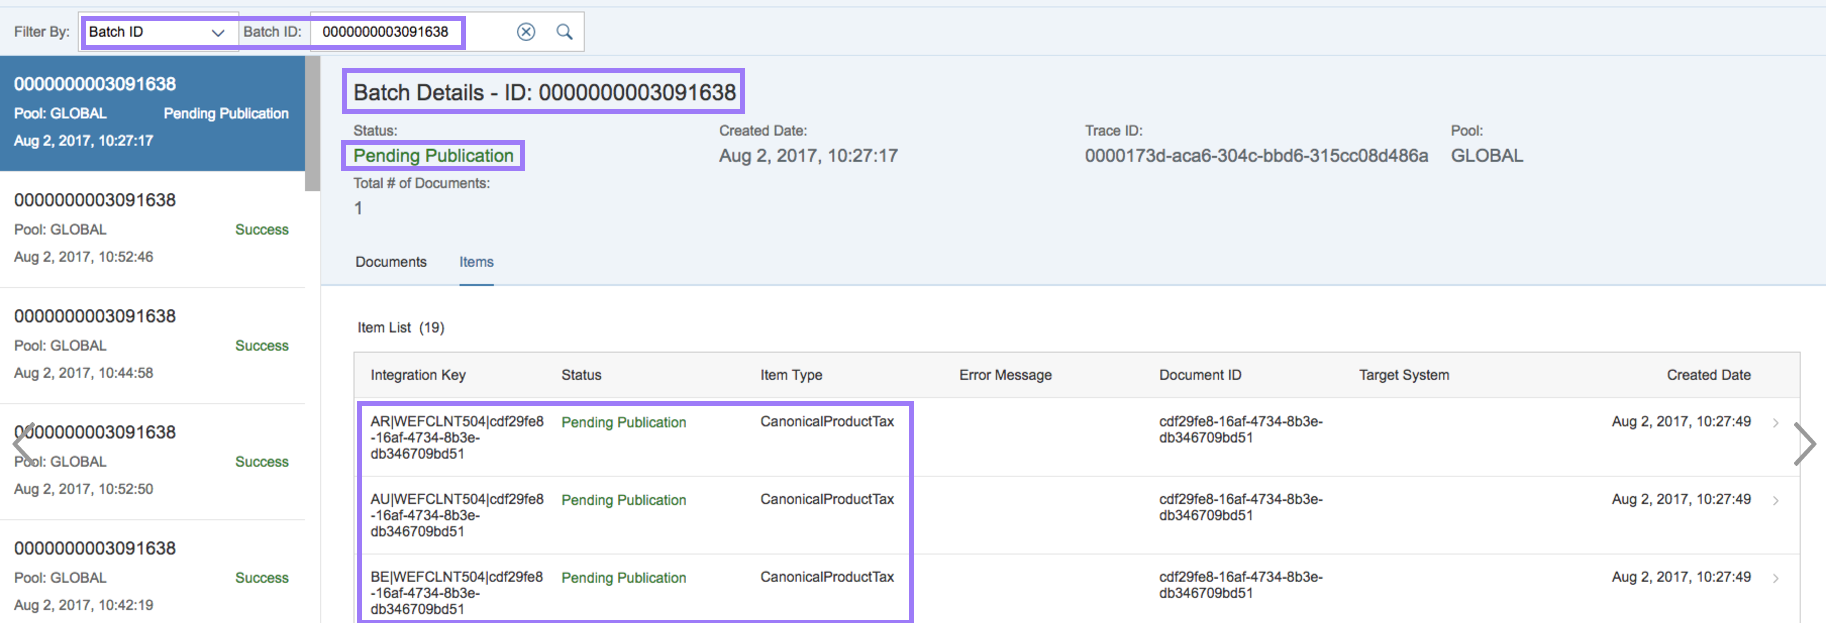
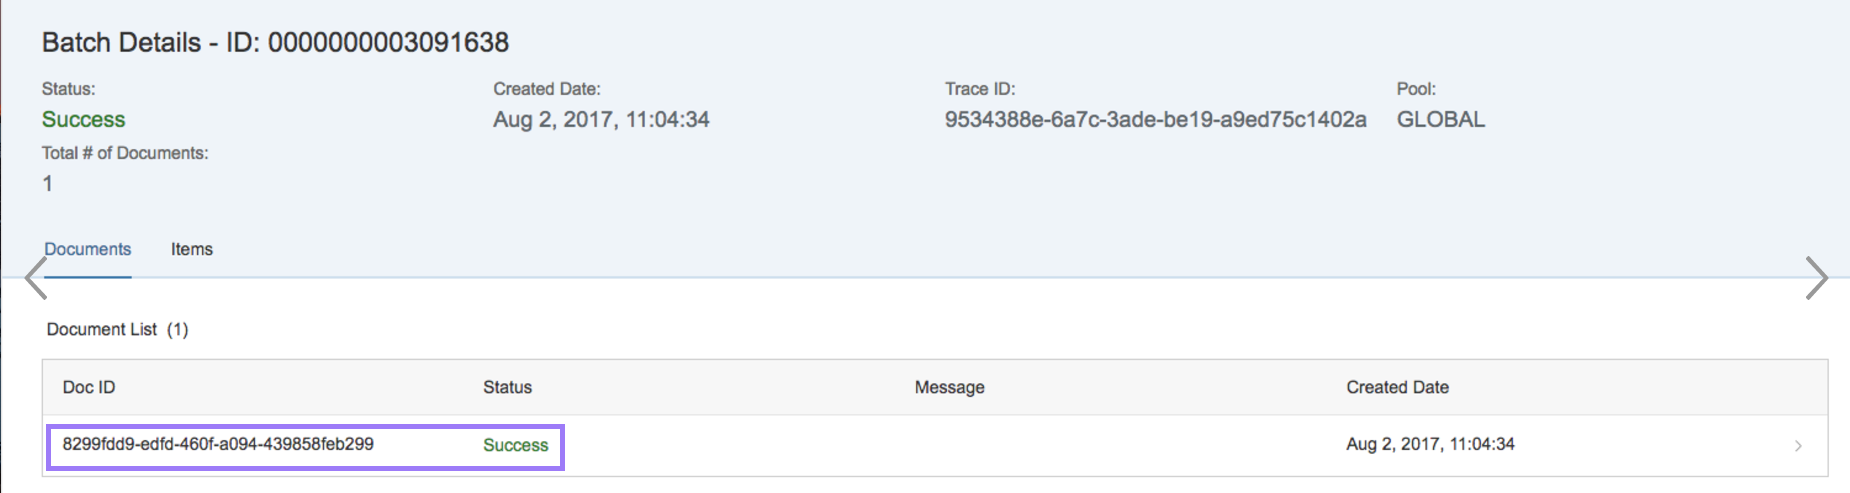
The Doc ID is synonymous with the segment value of an IDoc. The other columns are self-explanatory. You're not done with this screen, however. Click on any row to view the document details for that Doc ID. The following images illustrate the information you can find when you select an item.
You have one more thing to see in the batch mode. To the right of the Documents tab is another tab called Items. Items refers to Data Hub data structure items. The following graphic illustrates what you might see:
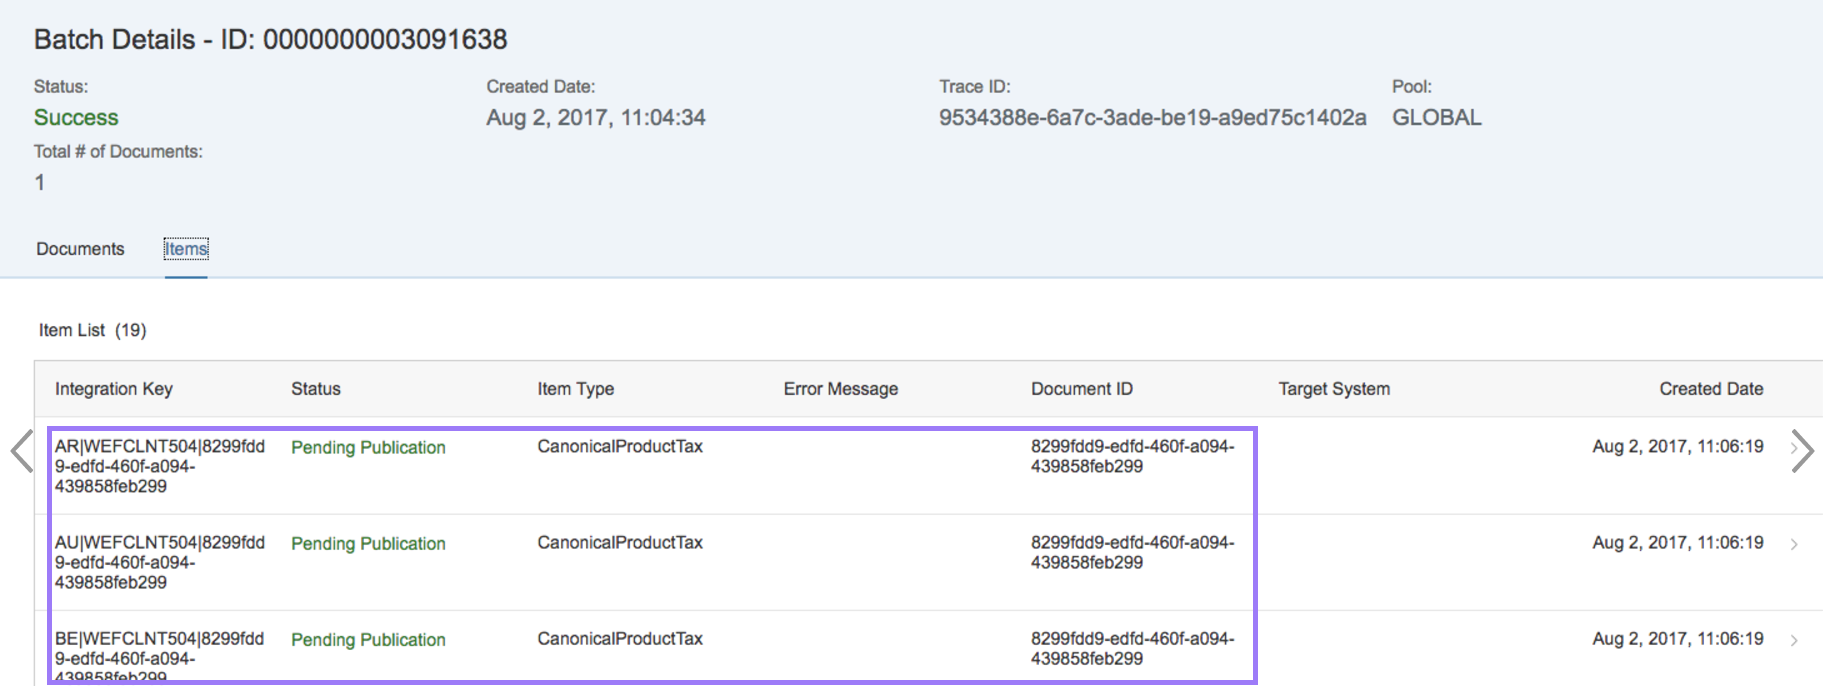
The context here is a Data Hub data structure item. The Data Hub data structure uses the Integration Key as one of its data record identifiers. The Item Type you see is a common one in Data Hub.
When you're reviewing your Data Hub data in the Data Hub Monitoring application, you might see errors. The Data Hub Monitoring application is read-only, so there is no facility for addressing errors. You must go back to Data Hub or to the source data to fix these problems.
Finally, the system keeps your data for seven days. When the data is eight days old, the system automatically deletes it.
Getting Assistance
Data Hub Monitoring has multiple sources of assistance.
- Volunteer staff man the Experts Forum. They help with many SAP Hybris products, including the Data Hub Monitoring application. Connect to the Forum at this site: Experts Forum
- To get assistance with YaaS, reach out at this site: YaaS Assistance
- Finally, you can get the full explanation for the Data Hub side of the monitoring process at this site: Data Monitoring Help
If you find any information that is unclear or incorrect, please let us know so that we can improve the Dev Portal content.
Use our private help channel. Receive updates over email and contact our specialists directly.
If you need more information about this topic, visit hybris Experts to post your own question and interact with our community and experts.